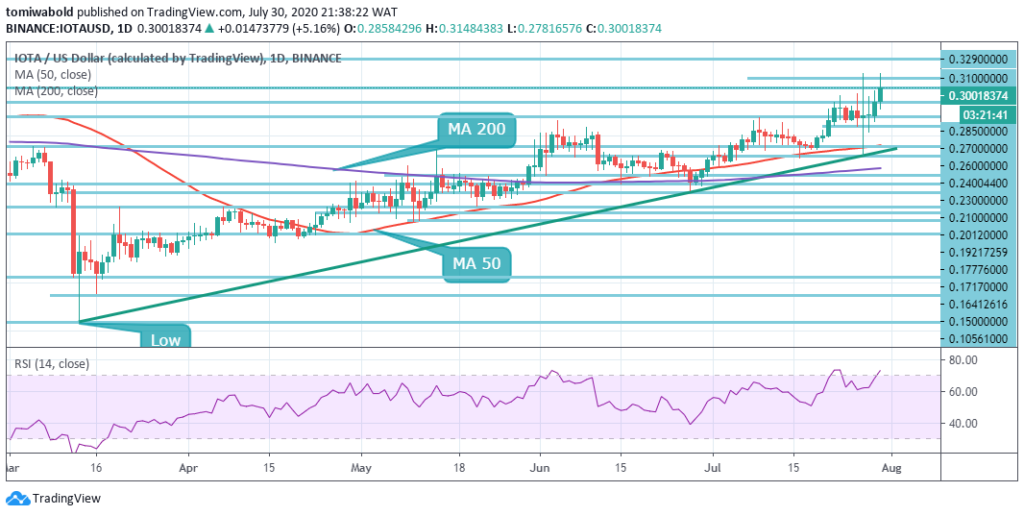
IOTA exchanges in green amongst a few other specific market tokens. IOTA is at the forefront of the cryptocurrency rally on the day after dominant progress from $0.2858 (opening value) to $0.3001 (prevalent market value) at $0.3130 intraday high. The daily IOT/USD chart has bullish signals embedded technically. Bulls stay at the forefront as buyers push IOT/USD past key hurdle at $0.31. The overall market cap for IOTA now stands at $832.16 million, with trading volumes of $35.98 million over the past 24 hours. Bitcoin (BTC) dominates exchange-traded prices in the past 24 hours far ahead of IOTA. Meanwhile, the value of IOTA is increasing at $0.3001. Recently, the IOTA Foundation launched Stronghold, a series of multi-purpose libraries for secure password management, personal data, and private keys, hence setting a further significant building block for IOTA adoption. Stronghold is an application of software designed solely to protect digital secrets from hackers and data leaks.
*The daily IOT/USD chart has bullish signals embedded technically
*Bulls stay at the forefront as buyers push IOT/USD past key hurdle at $0.31
*Recently, the IOTA Foundation launched Stronghold, a series of multi-purpose libraries for secure password management, personal data, and private keys
Key Levels
Resistance Levels: $0.3600, $0.3290, $0.3100
Support Levels: $0.2850, $0.2600, $0.2400
 IOT/USD Daily Chart
The technical view on the daily reflects the likelihood of a medium-term rally taking over the $0.31. The upward rising RSI and the MA 50 serving as a robust buffer brings this scenario to reality. The former is staying at the overbought area at 70; acceleration whether upwards or downwards may predict the path the price will follow upwards.
In the opposite scene, IOTA is likely to bounce off initial support at $0.2700 if declines come into play. Further losses may seek structural strength at the ascending trendline support, the MA 50 ($0.2400), the $0.2300 horizontal support level, the MA 200 ($0.2171), and $0.2012 beneath. On the daily IOT/USD chart, nevertheless, there are bullish signs embedded everywhere.
 IOT/USD 4-Hour Chart
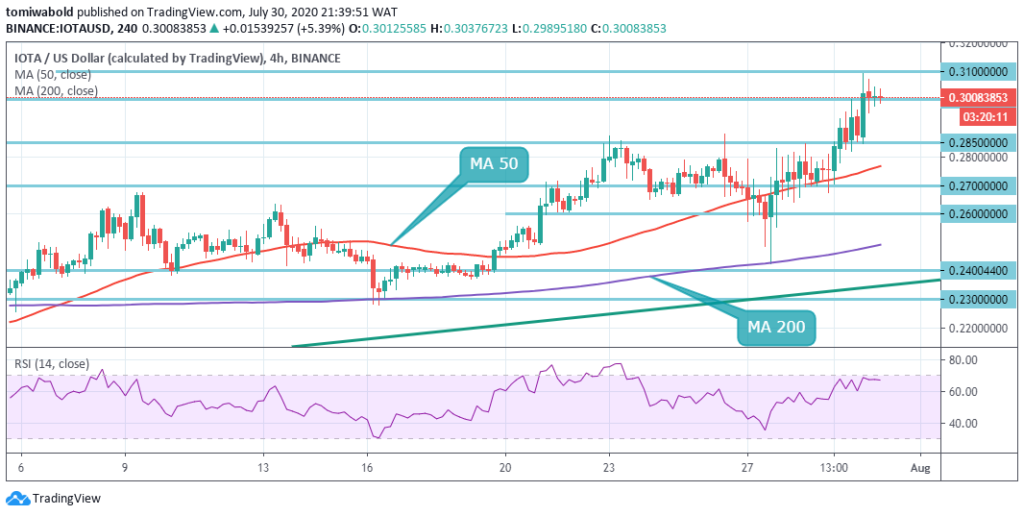
In the short term, IOTA remains technically bullish as traders continue to keep prices beyond the tokens trend marking key MA 50. Significant support on the 4-hour trendline suggests that the IOT/USD pair may still rally to the $0.3100 level. All in all, in anticipation of a more short-term upside, IOT/USD traders are expected to buy any dips towards the $0.2850 level.
In a flag formation, the price still trends horizontally. The 4 hour MA 50 reveals heightened bullish momentum. The RSI trends horizontally to about 70, just beneath the overbought level. The IOT/USD pair is only bullish while exchanging beyond the level of $0.2700, the main resistance is $0.3290 and $0.3600 levels. If the IOT/USD pair is moving underneath the $0.2850, sellers may test the support levels of $0.2700 and $0.2400.
Note: Kryptomoney.com is not a financial advisor. Do your research before investing your funds in any financial asset or presented product or event. We are not responsible for your investing results
Image Credit: Shutterstock
Keep in mind that we may receive commissions when you click our links and make purchases. However, this does not impact our reviews and comparisons. We try our best to keep things fair and balanced, in order to help you make the best choice for you.