The cryptocurrency market terrain is mixed with red and green. BTC traded to highs above $26k while the majority of Altcoins manage to gather momentum after the XRP saga. IOTA reached highs of $0.4531 on November 24, but the price failed to hold above this level. IOTA/USD then found solid support at the $0.271 level while the pair fights to break key resistance above $0.31. IOTA is trading at $0.2904 at the time of this post, down from its prior day high of $0.3270. Daily, the coin has lost nearly 2% and 15% on the weekly. IOTA’s total market cap now stands at $7.9 million with a trading volume of $21.55 million in the past 24 hours. IOTA Releases Stronghold Alpha. Stronghold is an open-source software library that was originally built to protect IOTA Seeds but can be used to protect any digital secret. On December 24, in an official blogpost, IOTA announced the Alpha release of the IOTA stronghold. Stronghold will form a secure base for the new IOTA Firefly wallet.
*IOTA reached highs of $0.4531 on November 24
*IOTA is trading at $0.2904 at the time of this post, down from its prior day high of $0.3270
*On December 24, in a blogpost, IOTA announced the Alpha release of IOTA stronghold ”Saint-Malo”
Key Levels
Resistance Levels: $0.4530, $0.4000, $0.3500
Support Levels: $0.3000, $0.2700, $0.2380
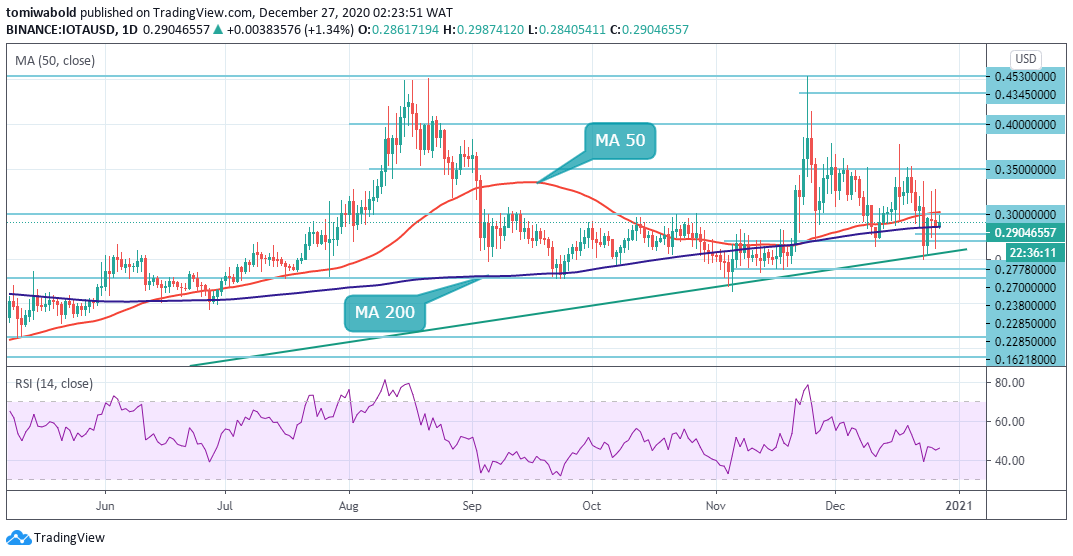 IOTA/USD Daily Chart
IOTA rebounded from lows of $0.25 on December 23 to trade at highs at $0.3368 in subsequent sessions. Further resistance at $0.3368 caused the IOT price to drop. A pick up in IOTA price to prior day highs of $0.3270 was bluntly rejected by the bears as IOTA made a subsequent downward move.
Barring an extended selloff, support is envisaged at $0.2828 situated at the MA 200 and then at $0.2665 coinciding with the ascending trendline support. On the other hand, a sustained break above $0.3270 holds the key to the IOTA uptrend. In this scenario, the first major resistance sits at $0.35 while the second one is at $0.40. Once these hurdles are cleared, IOTA may retest the $0.4345 level and then $0.4530.
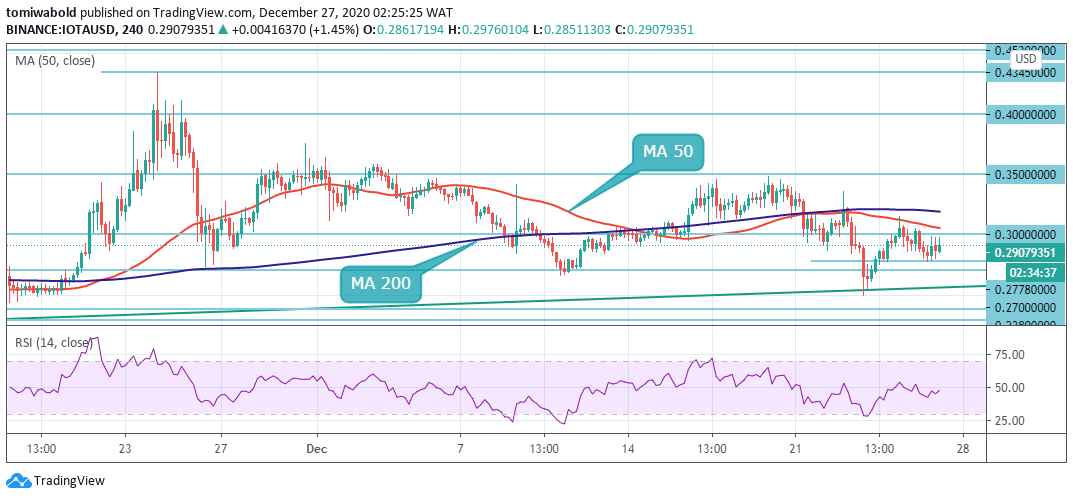 IOTA/USD 4-Hour Chart
IOTA’s decline on the 4-hour chart paused when the token embraced near term support at $0.2778. IOTA lost the 4 hour MA 50 and MA 200 since December 23rd. IOTA may then need to reclaim the MA 50 near $0.31 for its uptrend to continue. The resistance cap at the MA 200 situated at the $0.32 mark may further limit upside action.
To the upside, dip-buyers could be looking for a buying opportunity below the $0.270 level, with the $0.4530 level being the main upside target. On the flip side, if the price turns down again from current levels, support is envisaged at $0.270 and $0.2380. The IOTA/USD pair is only bullish while trading above the $0.3200 mark, key resistance is found at the $0.35 and the $0.40 levels.
Note: Kryptomoney.com is not a financial advisor. Do your research before investing your funds in any financial asset or presented product or event. We are not responsible for your investing results
Image Credit: Shutterstock


Keep in mind that we may receive commissions when you click our links and make purchases. However, this does not impact our reviews and comparisons. We try our best to keep things fair and balanced, in order to help you make the best choice for you.