
As the weekend approaches, most crypto assets are seen declining after BTC posted losses beneath $48k. Internet of Things (IoT) crypto, IOTA (MIOTA) is pushing higher despite the market correction. IOTA entered a corrective phase after attaining yearly highs of $1.70 on Feb. 19. The declines to lows of $0.8789 were followed outrightly by a consolidation period before IOTA resumed the uptrend. On March 5, a steady climb on IOTA/USD mounts to intraday highs of $1.50. At the time of writing, IOTA is trading at $1.375, up by 14.54% in the past 24 hours and 23.51% on a 7-day basis, placing it among the best performing digital assets. Ranking 20th largest, IOTA’s total market cap now stands at $3.75 billion with a trading volume of $384 million in the past 24 hours. IOTA/USD price is rising after the IOTA parent company released the smart contracts protocol ahead of Coordicide rollout. Bitfinex trading platform has added IOTA as collateral on Bitfinex Borrow after a successful social media poll vote. IOTA is now among 13 digital tokens available as collateral on Bitfinex Borrow.
*IOTA is up by 14.54% in the past 24 hours and 23.51% on a 7-day basis, placing it among the best performing digital assets
*IOTA/USD price is rising after IOTA parent company released the smart contracts protocol ahead of Coordicide rollout
*IOTA is now among 13 digital tokens available as collateral on Bitfinex Borrow
Key Levels
Resistance Levels: $1.9020, $1.7044, $1.5041
Support Levels: $1.1000, $0.8789, $0.6500
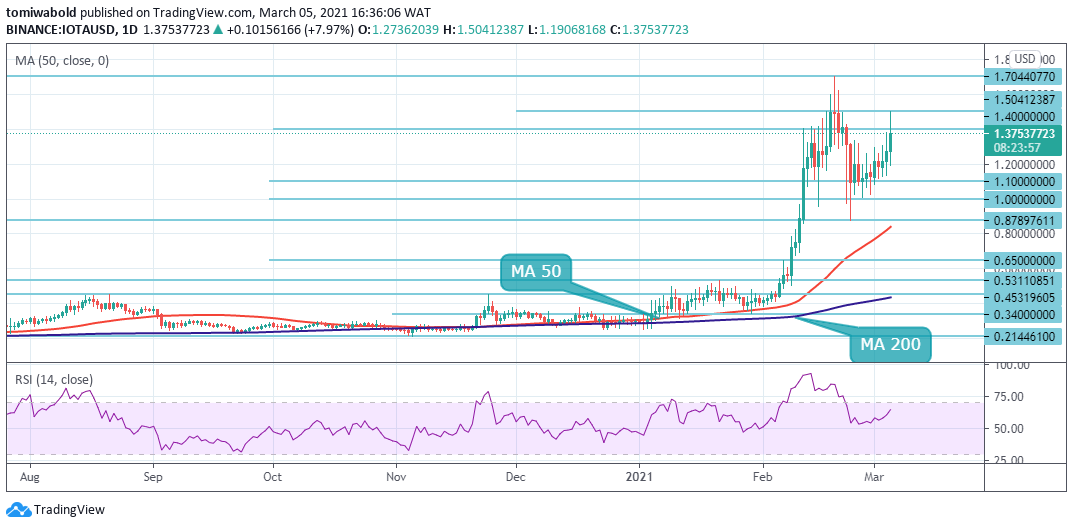
On the daily chart, the buyers have driven MIOTA price past the confluence zone at $1.33, indicating the resumption of the uptrend. The IoT crypto could now rally past the next target objective at $1.50 where the bears could mount a resistance. A sustained break past $1.50 could cause the MIOTA/USD pair to rally towards $1.70.
Both moving averages are sloping up and the RSI in the positive territory, suggesting that bulls are in control. On the other hand, if the price turns down from the current levels and the bears succeed in sinking the IOTA price below $1.0, a fall to the MA 50 at $0.84 is possible. A breach beneath this support may signal the start of a deeper correction.
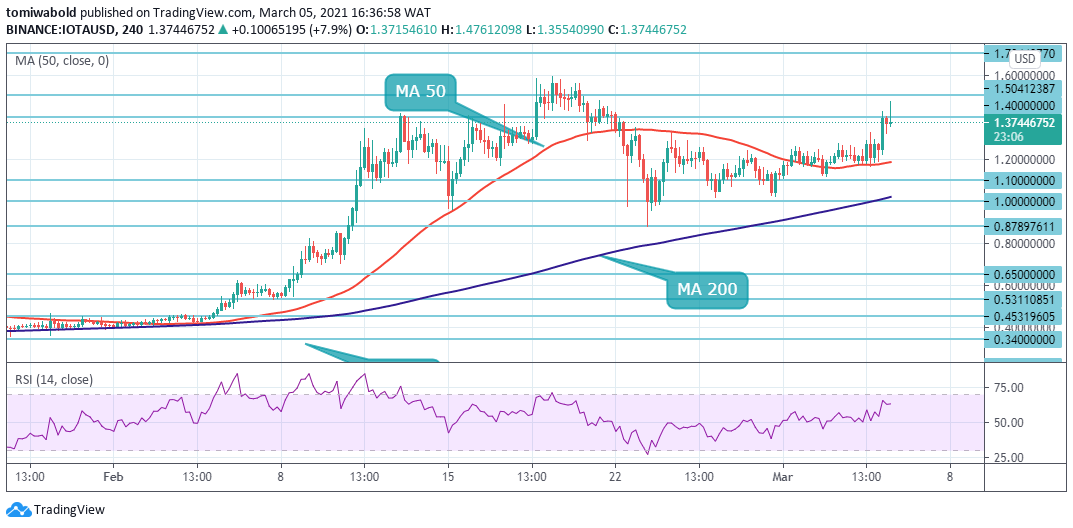 IOTA/USD 4-Hour Chart
 IOTA flipped the MA 50 resistance into support on March 1st and continued to push higher from there. However, the resistance on the approach to $1.50 must be surmounted by IOTA bulls for the possibility of a retest of the $1.70 yearly highs to materialize. On the contrary, price declines beneath the current level may eye the MA 50 support at $1.17.
A break below this level may cause IOTA/USD to consolidate in a range for some days. If declines persist, IOTA may be forced to revisit support at the MA 200 support coinciding with $1.02. Further breakdown may bring the support at $0.878 into the picture. The IOTA/USD pair is only bullish while trading above the MA 200, key resistance is found at the $1.50 and the $1.70 levels.
Note: Kryptomoney.com is not a financial advisor. Do your research before investing your funds in any financial asset or presented product or event. We are not responsible for your investing results
Image Credit: Shutterstock


Keep in mind that we may receive commissions when you click our links and make purchases. However, this does not impact our reviews and comparisons. We try our best to keep things fair and balanced, in order to help you make the best choice for you.
