
Chainlink is leading the way as the cryptocurrency market climbs positively on improving risk sentiment. LINK token continues to make its way further into traditional finance as institutional investors become more interested in Chainlink’s trustless input and output to blockchain smart contracts. Dipping by about 20%, LINK went down with other cryptocurrencies on Dec. 4, hitting 3 months low of $16.72 as the Omicron variant rattles global markets. However as vaccine optimism offset fears, LINK has risen for the third day in a row on positive risk sentiment driving prices into profit. At the time of writing, LINK/USD remains stable as bulls register intraday highs at $23.21. Former Google CEO Eric Schmidt has joined Oracle infrastructure provider Chainlink Labs as a strategic advisor. He commended Chainlink for “unlocking the potential of smart contract platforms and changing business and society” in a statement announcing the appointment.
Key Levels
Resistance Levels: $30.23, $27.50, $24.00
Support Levels: $21.00, $18.50, $13.38
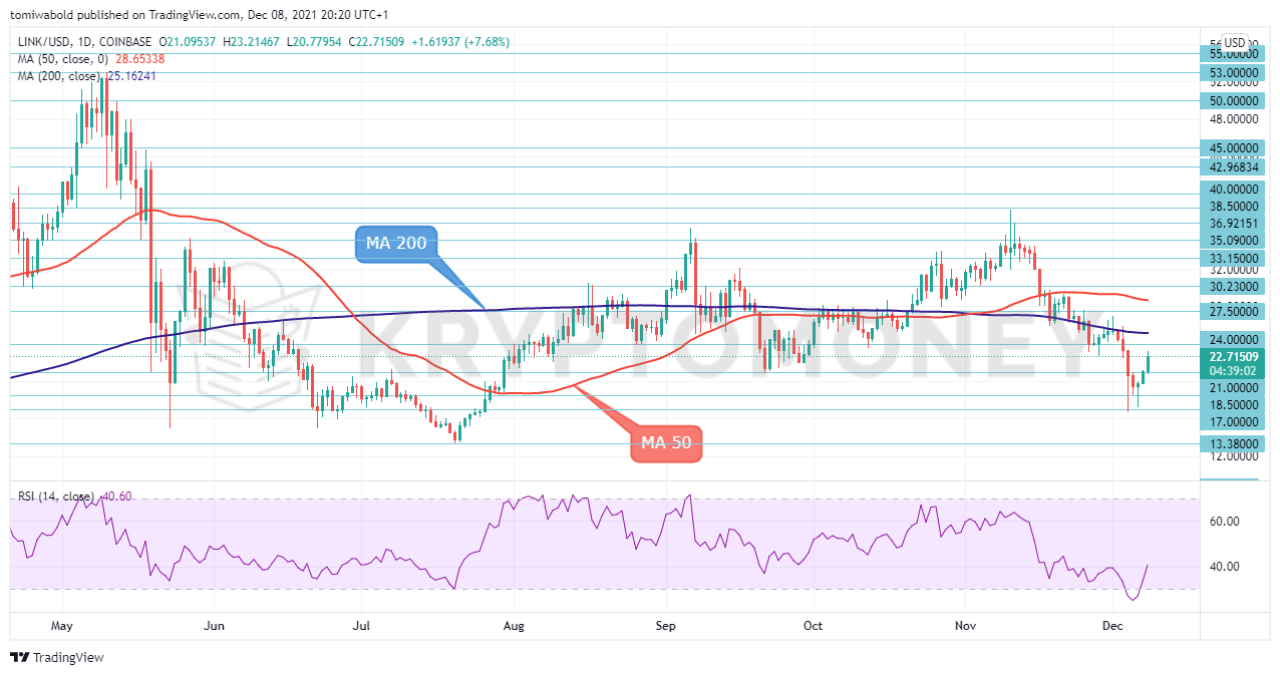 LINK/USD Daily Chart
LINK prices are flirting with the $24.00 round number in the near term after the positive move that started in the past three days. According to technical indicators, the relative strength index (RSI) is heading north into the positive region, while the moving average (MA 50) is trying to hold in the bullish area. The moving average (MA 200) is ready to act as resistance while flattening out.
If the price continues the rebound structure, the next crucial level could come from the moving average (MA 200) which overlaps the $24.00 horizontal resistance. Slightly higher, the $27.50 barrier may halt the bullish actions before meeting the moving average (MA 50) at the $28.50 region. On the flip side, a decline beneath the horizontal support at $21.00 could take the bears towards the recent low of around $17.00.
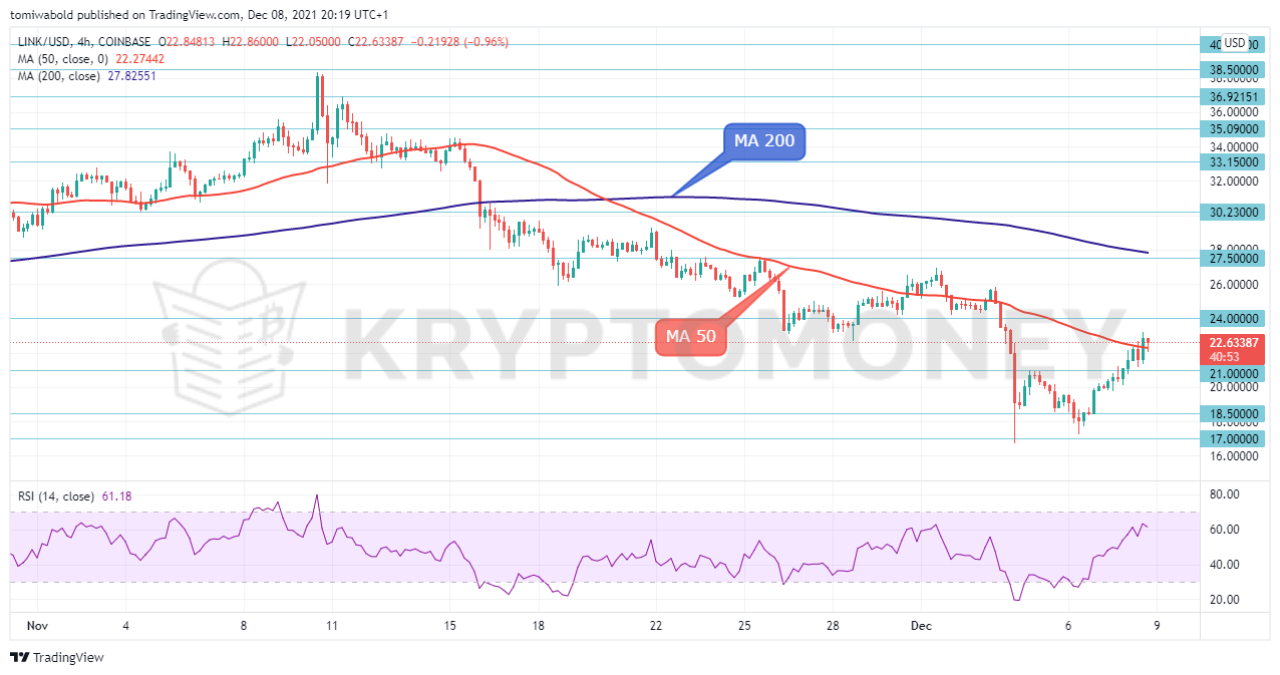 LINK/USD 4-Hour Chart
On the lower time frame, the price is recovering and currently bouncing from the short-term moving average (MA 50). We could see a continuation up or a move down depending on today’s close. The price is at crossroads within the $22.00-$23.00 trading zone. A bounce off the zone should be going towards $24.00 while the drop might aim towards $21.00-$18.50 level.
Currently, the short-term oscillators are not indicating a definitive direction in the pair. The price is now moving between the two moving averages (MA 50 and 200), while the price is flirting towards the $24.00 round level. The positively charged 4-hour relative strength index is reflecting the latest surge in buying interest but additional gains in price remain somewhat limited.
Note: Kryptomoney.com is not a financial advisor. Do your research before investing your funds in any financial asset or presented product or event. We are not responsible for your investing results
Image Credit: Shutterstock


Keep in mind that we may receive commissions when you click our links and make purchases. However, this does not impact our reviews and comparisons. We try our best to keep things fair and balanced, in order to help you make the best choice for you.
