Even as Bitcoin and several other main Altcoins are falling lower within the aggregated crypto market due to certain tempered signs of weakness, Chainlink has persisted to register extremely strong price action. On Friday, the No. 8 coin plummeted to as low as $9.16 before making a $10.29 rebound, though settling beyond the $10 mark. The heavily bullish LINK/USD stays in overbought zone past $10.50 amid bearish pullbacks. The LINK market cap stands today at $3.70 billion, centered on a circulating token supply of 350 million, with a trading volume of $1.15 billion over the past 24 hrs. Among the top-rated 20 coins by market value, LINK has been the top performer in the US dollar markets, gaining more than 5.77 percent since the day started. Zeus Capital LLP, an asset management company, has publicly alleged an artificial price pump by Chainlink. With the number of daily transactions on Chainlink, Google Trends, active addresses all at their all-time highs, yet optimistic fundamental indicators support its price gains.
*On Friday, the No. 8 coin plummeted to as low as $9.16 before making a $10.29 rebound, though settling beyond the $10 mark
*The heavily bullish LINK/USD stays in overbought zone past $10.50 amid bearish pullbacks
*Zeus Capital LLP, an asset management company, has publicly alleged artificial price pump by Chainlink
Key Levels
Resistance Levels: $12.50, $11.80, $11.00
Support Levels: $10.00, $9.00, $8.10
 LINK/USD Daily Chart
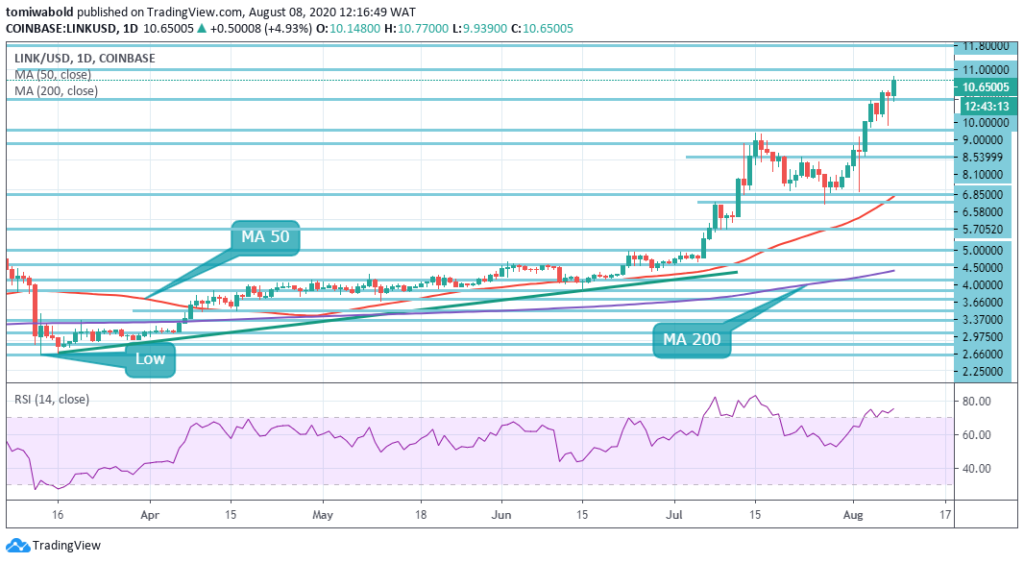
After a bearish session on Friday, the daily LINK/USD bulls regained market control. The price went up from a low of $9.16 on Friday to hit $10.77 in today’s activity. The price is hovering around the RSI’s overbought level, indicating it is overbought presently. Also, the RSI depicts growing bullish momentum. Stable support is at $9.0 and $8.10. The daily MA 50 line’s rising trend is suggesting its growing market volatility.
This upswing signifies a large addition of the traction initially generated when the cryptocurrency ran in late July from lows of $6.50. From this phase forward, its buyers have been in complete charge of its price activity, and many signs of weakness are not shown. Once LINK does not generate an unwanted surge of profit-taking, it is highly probable that it will set even higher highs shortly.
 LINK/USD 4-Hour Chart
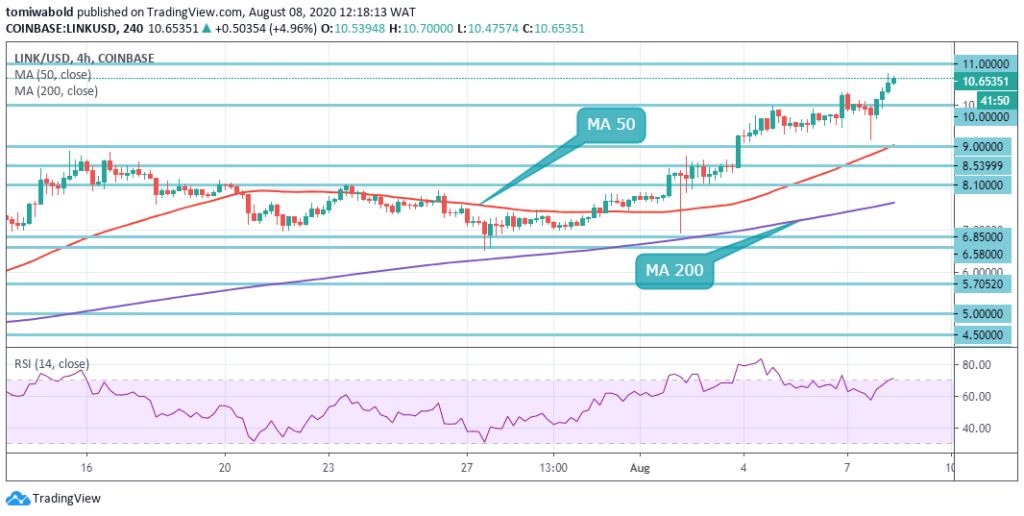
LINK tends to be steadily bullish over the weekend as the cryptocurrency progresses to aim for fresh 2020 high. LINK/USD bulls may reach a resistance level of $12.50 if it can achieve a technical breakout beyond $11.00. To the downside, multiple daily price closures beneath the level of $10.00 should motivate a technical sell-off to the level of $9.00 around the 4 hour MA 50.
A sharp rise in the selling pressure behind LINK could see it pull back to $8 zone or lower, price beneath the MA 50 can be considered as zones likely to find support and oversold conditions may be considered. The LINK/USD pair is only bullish while exchanging beyond the level of $8.50, the main support is seen at the $11.00 and $12.50. Sellers might test the $9.00 and $8.50 levels once the LINK/USD pair exchanges beneath the $10.00 level.
Note: Kryptomoney.com is not a financial advisor. Do your research before investing your funds in any financial asset or presented product or event. We are not responsible for your investing results
Image Credit: Shutterstock
Keep in mind that we may receive commissions when you click our links and make purchases. However, this does not impact our reviews and comparisons. We try our best to keep things fair and balanced, in order to help you make the best choice for you.