Chainlink (LINK) is one of the few proven cryptocurrency probably flying the bull flag trend. The project was introduced in 2017, now its token ranks 12th in the overall cryptocurrency ranking with an estimated $1.3 billion market cap. LINK is shifting hands at $3.66 at the time of publishing. In the last 24 hours, the coin has gained more than 4 percent and risen weekly by 5 percent. LINK/USD recovery kicked off at the $2.20 level in April and continues to rise as high as $4 after a massive 20 percent surge in the price of Bitcoin lately before the rise stalled ahead of correction. ChainLink is setting the highest Price Oracle Standards, Pricing oracles such as Chainlink offer the best infrastructure required to scale digital asset products, specifically in the DeFi space by arranging and vetting price feeds from on- and off-chain sources to create a transparent average price.
*LINK/USD recovery kicked off at the $2.20 level in April and continues to rise as high as $4
*The coin has gained over 4% in the recent 24 hours and increased by 5% weekly
*Pricing oracles such as Chainlink offer the best infrastructure required to scale digital asset products
Key Levels
Resistance Levels: $5.00, $4.50, $4.00,
Support Levels: $3.66, $3.00, $2.66
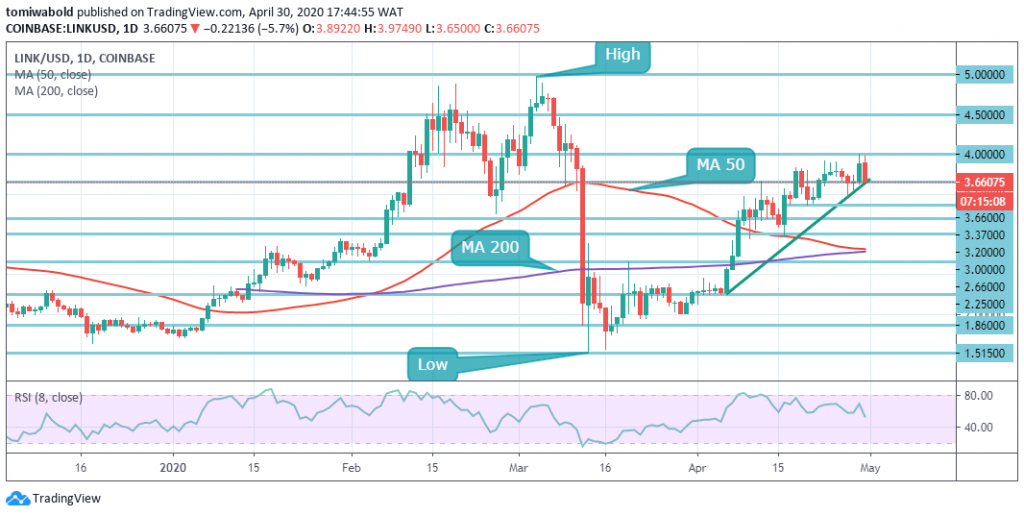
Looking at the daily chart above we could visibly see the turnaround which began with the upside traction unchanged in April. The cryptocurrency went berserk as the price for the token soared to hit as high as $4 from a low of about $2.20. This recent significant rally suggests that the bulls are returning despite stalling at $4 ahead of correction to the level of $3.66 which could inspire investors to rally to the next $4.50 level of resistance.
If LINK descends beneath $3.66 level, due to its unique low trading volume and weakness since April 9, the price will probably only target $3.20 level, revealing a weak bullish action. Although if buying intensity increases, the bulls can also reclaim the current peak of $4.98. LINK nevertheless appears bullish for as long as it can hold beyond the level of $3.66.
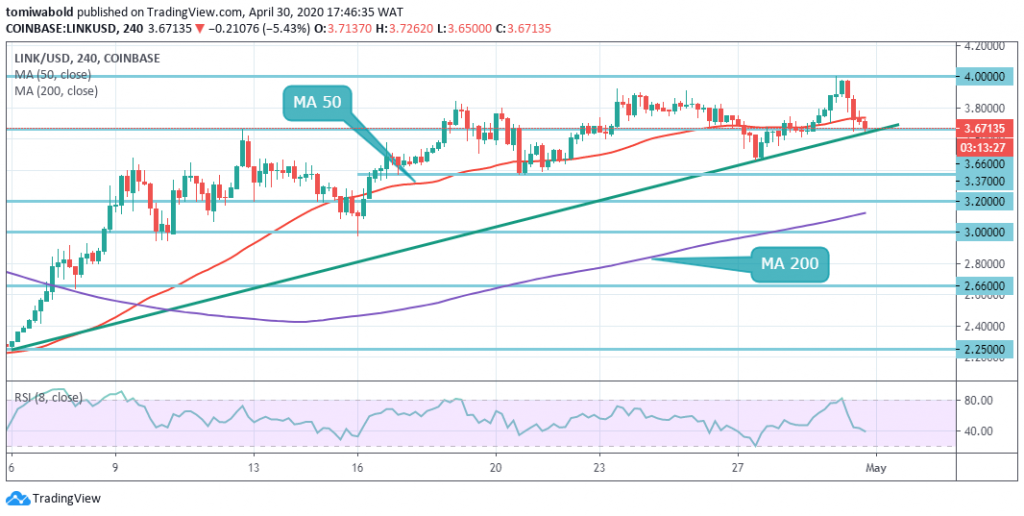
Chainlink is trading beyond the trendline support seen in the 4-hour chart. The crypto asset tested the $3.2 region earlier on April 16 but recently advanced to $4.00-level high. A monthly high correction may embrace the support offered by the convergence zone taken from the last $3.66 swing high level up to a next $3.2 level swing low.
As was shown, Link is attempting to hold the bullish trend around the upper limit of the range. Only when the price declines, it is projected that Chainlink may discover a rebound at $3.37 level around the next support for the trend. If another price drops off the 4-week trajectory, it may just fall straight to $3.2 level and probably $2.66 support level.
Note: Kryptomoney.com is not a financial advisor. Do your research before investing your funds in any financial asset or presented product or event. We are not responsible for your investing results
Image Credit: Shutterstock


Keep in mind that we may receive commissions when you click our links and make purchases. However, this does not impact our reviews and comparisons. We try our best to keep things fair and balanced, in order to help you make the best choice for you.