
The cryptomarket terrain is in red with BTC volatility spilling over to Altcoins. after a surprising recovery rally from the weekend session, most crypto assets reversed prior gains following an intense day of volatility on Dec. 1. LINK surged to $16.42 on November 24 but the price failed to hold above this level due to rejection. After a decline towards $11.28, a recovery thereafter ensued. Rebound on LINK/USD hits barrier at $14.91 as bears mounted guard. Chainlink is exchanging hands at $13.72 after trading at an intraday high of $14.91, down by 4.06% in the last 24 hours. LINK’s present market cap stands at $5.35 billion, based on a 394 million circulating token supply, with $1.80 billion in trade volume over the past 24 hours. Chainlink declares support for the ETH ecosystem through Gitcoin Grants Round 8. The Chainlink team stated its support towards the open-source development of in-demand Ethereum infrastructure projects by donating funds to Gitcoin Grants Round 8.
*After a decline towards $11.28, a recovery thereafter ensued
*Chainlink is exchanging hands at $13.72 after trading at an intraday high of $14.91
*Chainlink declares support for ETH ecosystem through Gitcoin Grants Round 8
Key levels
Resistance Levels: $18.00, $16.00, $15.00
Support Levels: $13.00, $12.00, $11.00
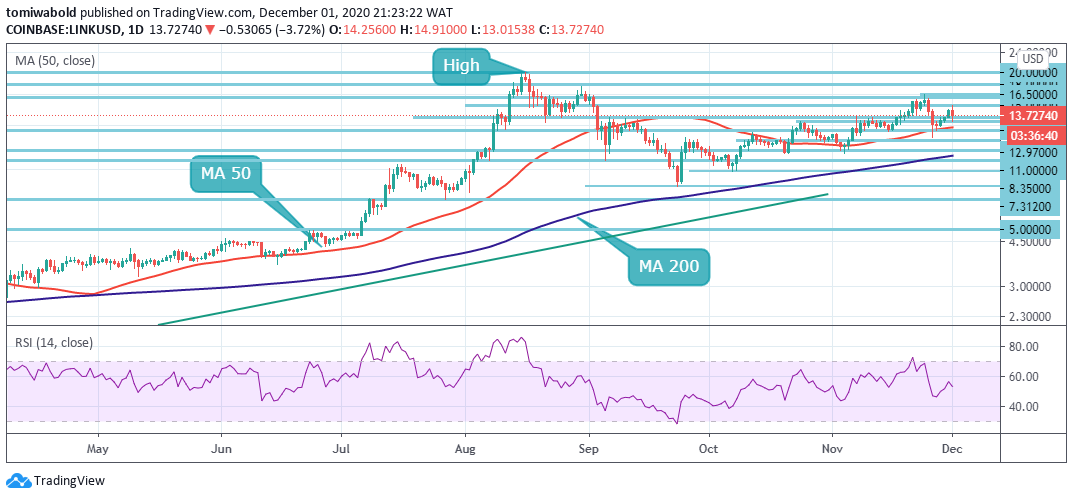 LINK/USD Daily Chart
As seen on the daily chart, a recovery ensued when Chainlink (LINK) bounced off the MA 50 support at $12.02. The bulls managed to push the price back above $13 to highs of $14.91 where a barrier was met. If the bears sink the price back below $13, it may suggest a bearish sentiment. A break and close beneath the MA 50 at $12.31 could start a deeper correction towards the prior week’s low at $11.28.
Further selling pressure may cause LINK to retest its October lows of $8.35. On the flip side, if the bulls push the price above $14.91, LINK/USD could rally back to $16.42 and then $20. The RSI just above the midpoint does not give a clear advantage either to the bulls or the bears.
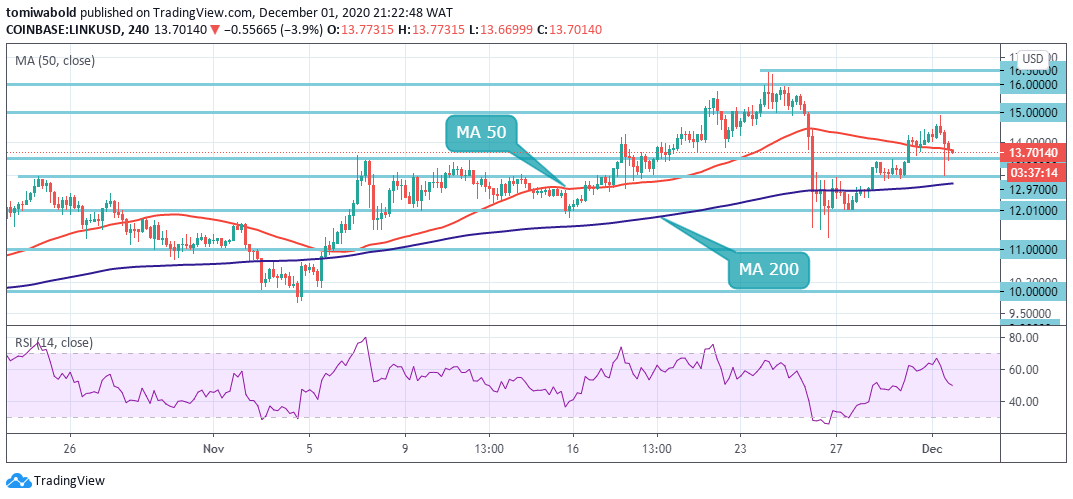 LINK/USD 4-Hour Chart
On the 4-hour chart, bears mounted a stiff resistance at the $15 region which saw the price turning southwards. The bulls however swung in to defend the $13 level as a slight rebound occurred, pushing LINK to its present price. If the bears succeed in sinking price beneath $13, LINK may retest the 4-hour MA 200 at $12.72. A further breach may cause LINK to seek the next buyer congestion zone between $12 and $10.
On the upside, a breach beyond $15 would cement buyers’ position in the market and may create enough volumes for a rally towards $16 and $20. The LINK/USD pair is only bullish while trading above the $13.5 level, key resistance is found at the $15 and the $16 levels. If the LINK/USD pair trades below the $13, sellers may test the $12 and $11 support levels.
Note: Kryptomoney.com is not a financial advisor. Do your research before investing your funds in any financial asset or presented product or event. We are not responsible for your investing results
Image Credit: Shutterstock


Keep in mind that we may receive commissions when you click our links and make purchases. However, this does not impact our reviews and comparisons. We try our best to keep things fair and balanced, in order to help you make the best choice for you.
