From today’s Litecoin price analysis, if the bulls break above the EMAs, the price will rise to retest the $134 and $140 resistance levels. What is next? The following technical analysis reveals.
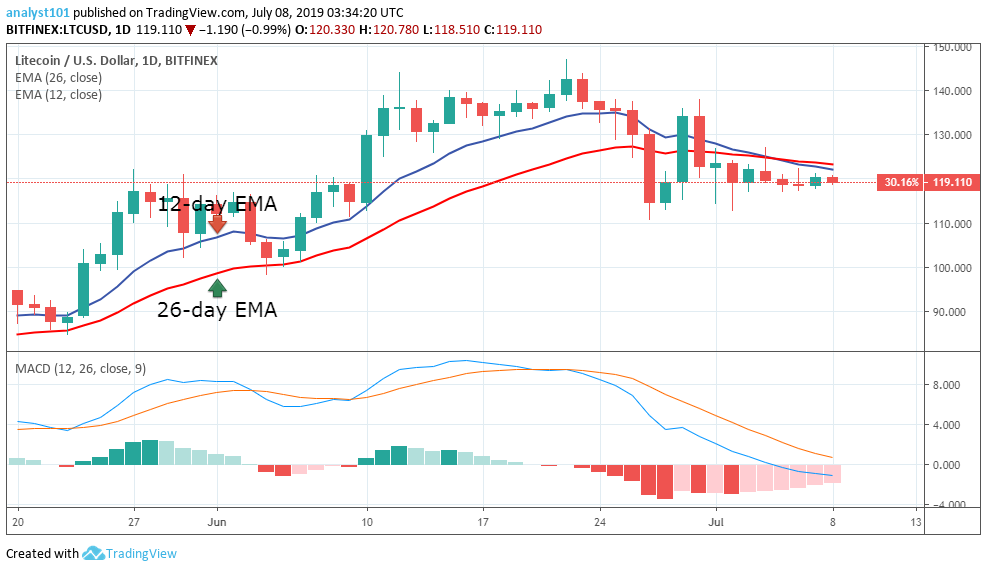
LTCUSD Price Chart
In retrospect, Litecoin (LTC) price was in a sideways trend on July 1, trading below the 12-day and the 26-day Exponential Moving Averages (EMAs). On June 22, LTC bulls pushed the price to a high of $140 level and were resisted. This resulted in Litecoin price going on a downward correction as the bears broke below the EMAs to reach the bearish trend zone.
The downward correction was on June 27 at the support level of $110 price level and below the EMAs. At the support level of $110, the bulls pulled above the EMAs but met resistance as the bears brought the price to the bearish trend zone below the EMAs.
The price of Litecoin is ranging below the EMAs which is an indication that the price may likely decline. On the upside, if the bulls break above the EMAs, LTC price will rise to retest the $134 and $140 resistance levels. On the downside, if the bulls are unable to break the EMAs, the Litecoin price will be in a range bound movement. In the meantime, the Moving Average Convergence Divergence (MACD) line and the signal line are above the zero line, which is an indication of a buy signal.
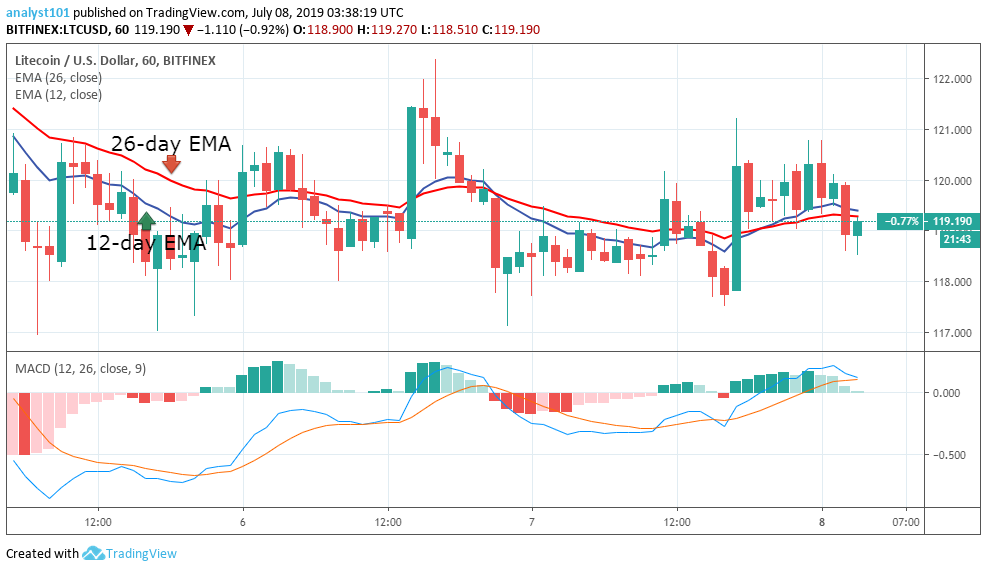
LTCUSD Price Chart
As the 1-hour chart shows, LTCUSD price is in a sideways trend as the 12-day and the 26-day EMAs are trending horizontally. LTC price is facing resistance at the $122 level. Making four attempts, LTC bulls tested the resistance level and on each attempt, LTCUSD price would drop to the support level of the EMAs after testing the resistance level. On July 6, the bulls tested the $122 price level but they were resisted. In the meantime, the MACD line and the signal line are above the zero line, indicating a buy signal.
Resistance Levels: $140, $150, $160
Support levels: $120, $110, $90
Arathur Stephen is not registered as an investment adviser with any federal or state regulatory agency. The Information above should not be construed as investment or trading advice and is not meant to be a solicitation or recommendation to buy, sell, or hold any cryptocurrencies. The information is solely provided for informational and educational purposes. Always seek the advice of a duly licensed professional before you make any investment.


Keep in mind that we may receive commissions when you click our links and make purchases. However, this does not impact our reviews and comparisons. We try our best to keep things fair and balanced, in order to help you make the best choice for you.