
In this Litecoin price forecast, if the price is sustained above the EMAs, the LTC bulls will retest the $92 and $96 resistance levels. What more can you expect?
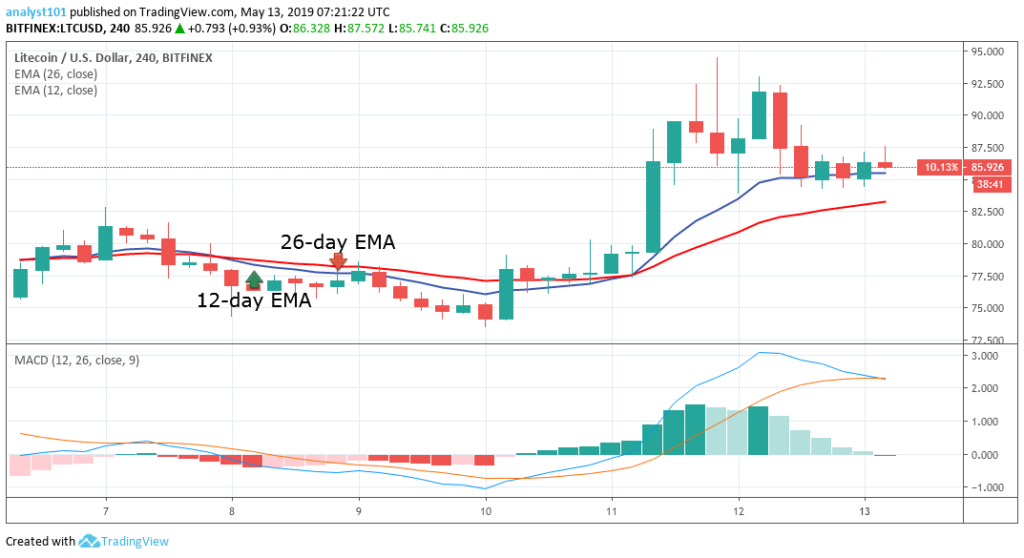
Litecoin (LTC) price was in a bearish trend zone in the past week. The bulls met resistance at the $84 price level as the price dropped to the bearish trend zone. It was assumed in the previous week that if the bulls break the 12-day and the 26-day Exponential Moving Averages (EMAs), the bulls were likely to retest or break the $82 and $84 resistance levels. On May Saturday, the bulls broke the resistance levels but it is currently facing another resistance at the $92.50 price level. On May 12, the bulls met resistance at the $92 price level, as a result, the Litecoin price declined to the 12-day EMA support level.
On the upside, if LTC price is sustained above the EMAs, the bulls will retest both the $92 and $96 resistance levels. On the other hand, if the bears break below the EMAs, the price of Litecoin is likely to drop to the previous low at $76 price level. The Moving Average Convergence Divergence (MACD) line and the signal line are above the zero line, an indication of a buy signal. Litecoin price is above the 12-day EMA and the 26-day EMA which also suggest that the price is in the bullish trend zone.
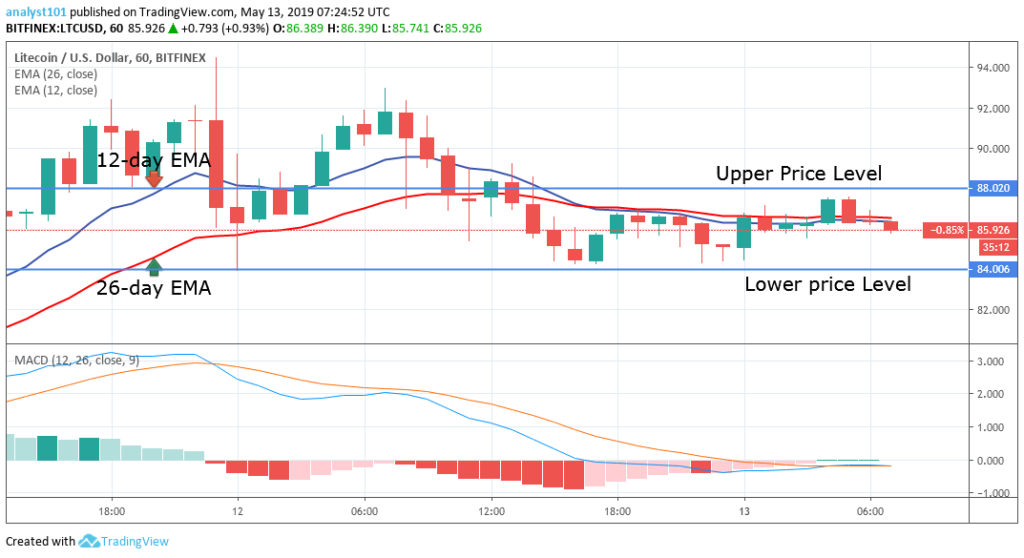
Looking at the 1-hour chart, LTCUSD price is in a sideways trend. The 12-day and the 26-day EMAs are trending horizontally. LTC price was facing resistance at the $92 price level. Last week the bulls tested the $92 resistance level but met resistance on three occasions. The price of LTCUSD dropped below the EMAs and it was trading below the 12-day and the 26-day EMAs.
On the upside, if the bulls break the EMAs, the LTC price will retest the $92 resistance level. On the downside, if the bulls fail to break the EMAs, the crypto’s price will continue its range bound movement below the EMAs. In the meantime, the MACD line and the signal line are below the zero line, indicating a sell signal. Litecoin price is now below the 12-day and the 26-day EMAs, which is an indication that Litecoin price is in the bearish trend zone.
Arathur Stephen is not registered as an investment adviser with any federal or state regulatory agency. The Information above should not be construed as investment or trading advice and is not meant to be a solicitation or recommendation to buy, sell, or hold any cryptocurrencies. The information is solely provided for informational and educational purposes. Always seek the advice of a duly licensed professional before you make any investment.


Keep in mind that we may receive commissions when you click our links and make purchases. However, this does not impact our reviews and comparisons. We try our best to keep things fair and balanced, in order to help you make the best choice for you.