
The entire crypto market has been inversely correlated with the dollar index and directly correlated with the stock market. While the increased volatility on the global markets took its toll on digital assets thus creating a risky asset reaction such as the recent price decline in LTC/USD. As such, Litecoin (LTC) lost all August gains and returned to the range that was dominant before mid-year. After a dip to fresh lows, LTC/USD rebounds past $44 in an attempt to defend demand zones. LTC/USD has increased from a low of $42.77 to register an intraday high of $44.33. The LTC market cap is currently 10th on the Coinmarketcap table at $2.88 billion, with $1.83 billion in exchange-traded volume over the past 24 hours. Following the rebound beyond $44, LTC trades at $43.90 while hunting for resistance, preferably above $45. The number of daily Litecoin transactions has exceeded 130,000 following the launch of LiteBringer, a decentralized fantasy game on September 15. The transaction increase occurs since every game player has to learn about LTC, its use as a cryptocurrency, and also have some Lites.
*LTC/USD has increased from a low of $42.77 to register an intraday high of $44.33
*After a dip to fresh lows LTC/USD rebounds past $44 in an attempt to defend demand zones
*The number of daily Litecoin transactions has exceeded 130,000 following the launch of LiteBringer
Key Levels
Resistance Levels: $55.50, $50.00, $45.00
Support Levels: $41.33, $37.17, $35.00
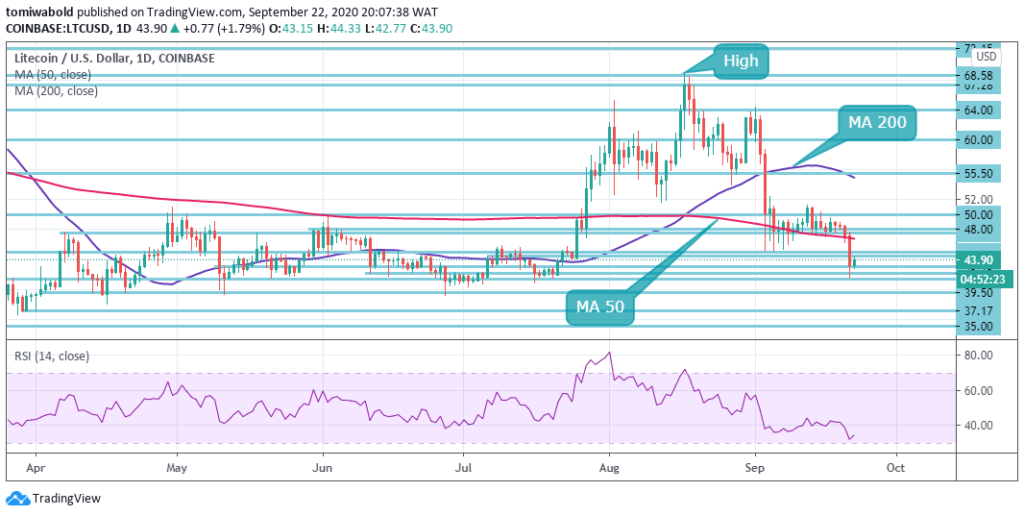 LTC/USD Daily Chart
As observed on the daily chart, LTC bulls have been in control after it rebounded from the mid $41.00 support zone and managed to go up to $44.33 over the last 24 hours. In the meantime, the sellers tried to smash beneath the $41.33 support level but were instantly hindered. The bulls must now try to go beyond the $45 that had struggled to sustain it earlier.
On the downside, the price is sitting on top of a healthy support level, so downside movement (for now) is somewhat limited. The RSI also shows that market momentum is about to reverse from bearish to bullish, so that’s another positive sign. As such, more price surge could be expected with likely price swings.
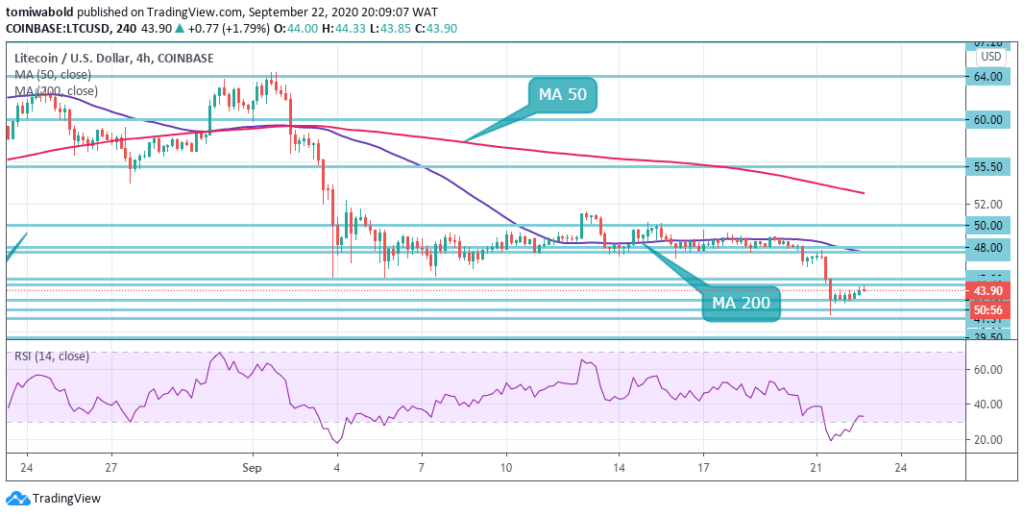 LTC/USD 4-Hour Chart
It is more visible to see Litecoin trade under further technical pressure, following a breakout below the horizontal support lines on the 4-hour time frame. The LTC/USD pair may sink towards the $41.31 support area over the short-term horizon, as per the technical analysis. In anticipation of more short-medium term upside, investors who are bullish towards the LTC/USD pair may consider buying from the price dip.
Meanwhile, the 4-hour chart RSI shows increasing bearish momentum, so overall sentiment in the chart remains bearish. The LTC/USD pair is only bullish while trading above the $45 level, key resistance is found at the $48 and the $50 levels. If the LTC/USD pair trades below the $41.31 level, sellers may test the $39.50 and $37.17 support levels.
Note: Kryptomoney.com is not a financial advisor. Do your research before investing your funds in any financial asset or presented product or event. We are not responsible for your investing results
Image Credit: Shutterstock


Keep in mind that we may receive commissions when you click our links and make purchases. However, this does not impact our reviews and comparisons. We try our best to keep things fair and balanced, in order to help you make the best choice for you.