Litecoin sits near the top as one of the most common digital currencies accessible, in an emerging and robust crypto-landscape. With an approximate market value of $2.6 billion, Litecoin is the 7th largest digital asset. At the time of writing, Litecoin is trading down nearly 2.5 percent in 24hrs at its current level, representing a marginal fall from nearly $42.00 daily highs. LTC/USD stays around $41 in a close range in the midst of drifting momentum. Key data metrics offered by Intotheblock slides bearish, as data posited by sifting into the on-chain composition of Litecoin suggest lower volumes of transactions during most of 2020, implying that players may lose interest in the crypto. Litecoin may strive to accumulate any continuous upward momentum.
*Litecoin is the 7th largest digital asset with the current market value of $2.6 billion
*LTC/USD stays around $41 in a close range in the midst of drifting momentum
*Key data metrics offered by Intotheblock slides bearish
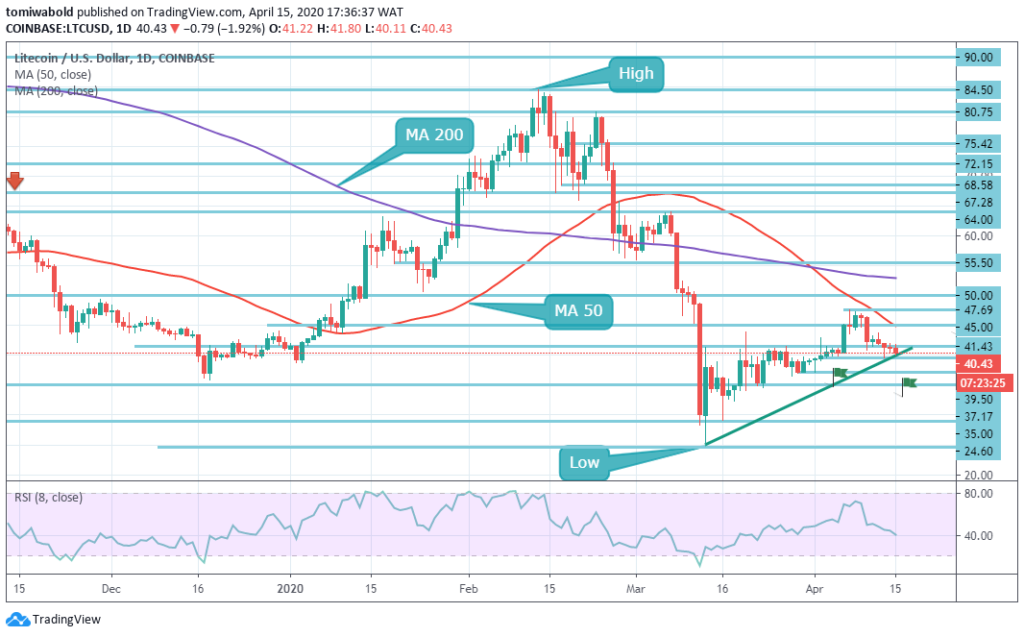
Key Levels
Resistance Levels: $55.50, $50.00, $45.00
Support Levels: $37.17, $35.00, $28.00
 As shown by Intotheblock’s stats, approximately 15 percent of LTC addresses are in the market at the current price, with a cluster of 125k addresses looking for the token to skyrocket to a level of $45.00 which may well push it to the break-even. This region could act as an area of resistance, preventing LTC from a broader rebound to $50.00 level.
Despite trading the price under $45.00 level and holding up for the past 5 days around the $41 mark, Litecoin (LTC) has fallen a little beneath it today. The price has begun to turn lower and the RSI has fallen into the negative zone, implying bears have the advantage. Specifically, the handful of large transactions might have lately surged, although the price has dropped, while the overall total large volume of transactions has plummeted from $4.3 billion on April 10 to $1.7 million, which may be justified in part by the drop in price.
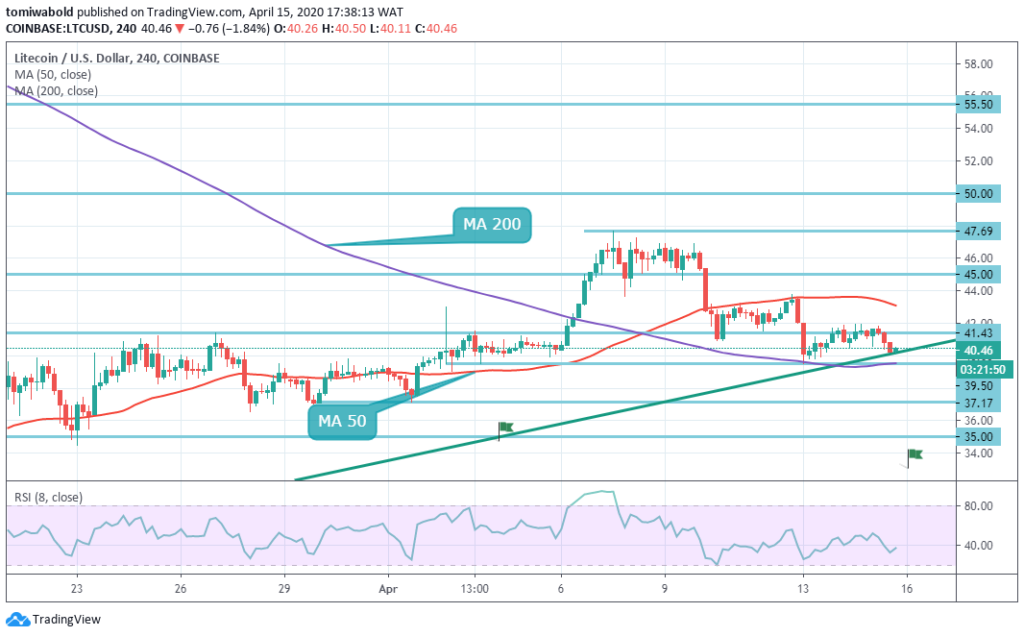 LTC/USD is shifting in a close range despite a drifting momentum on the intraday charts. The recovery is constrained to $45.00 level by MA 50 and the upper horizontal line on approach. When this obstacle is outside the path, the upside is likely to pick up momentum at $45.00 level to the next target, as well as the recent $47.69 high level.
On the contrary, the psychological $39.50 level and 4-hour MA 200 are providing initial support. A steady step underneath this level may boost the selling pressure and drive the price to a level of $37.17 (low on 4-hour April 1). This support is likely to slow the bears; nevertheless, only when it is breached, the sell-off may intensify at $35.00 level towards the bearish target established by the intersection of the upward trendline and horizontal support line.
Note: Kryptomoney.com is not a financial advisor. Do your research before investing your funds in any financial asset or presented product or event. We are not responsible for your investing results
Image Credit: Shutterstock


Keep in mind that we may receive commissions when you click our links and make purchases. However, this does not impact our reviews and comparisons. We try our best to keep things fair and balanced, in order to help you make the best choice for you.