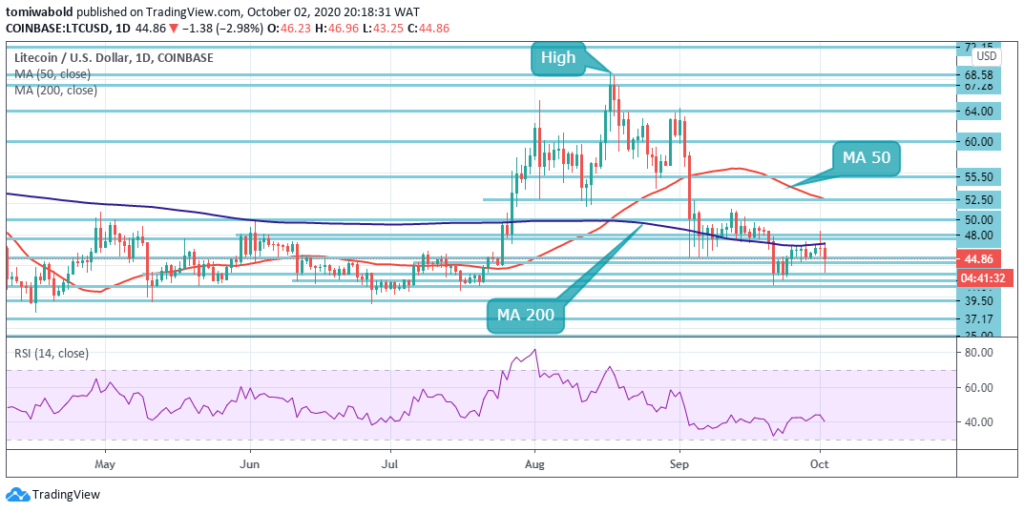
The cryptocurrency market is still swimming in turbulent waters, even as the weekend approaches. It has been a week with slight upside price movements as most crypto assets traded rangebound while bears and bulls tussled. The majority of crypto assets are following in Bitcoin’s footsteps in lackluster trading. Litecoin is scouting for direction in the near-term as it attempts to edge away from the worst levels of the prior month. After extensive consolidation, LTC bears hijack price to sub $44 level but met stiff support. Following a rebound, LTC now trades at $44.86 down by 2.98% as resistance mounts above MA 200. The LTC market cap is currently 11th on the Coinmarketcap table at $2.93 billion, with $2.61 billion in exchange-traded volume over the past 24 hours. David Burkett, LTC lead developer spoke recently on the MimbleWimble, the much-anticipated privacy upgrade as Litecoin MimbleWimble releases its Testnet. The final integration with LTC mainnet is not expected until next year. Mimblewimble is a protocol designed to achieve various improvements like greater scalability or privacy.
*After extensive consolidation, LTC bears hijack price to sub $44 level but met stiff support
*Following a rebound, LTC now trades at $44.93 down by 2.83% as resistance mounts above MA 200
*David Burkett, LTC lead developer spoke recently on the Mimblewimble, the much-anticipated privacy upgrade as Litecoin Mimblewimble releases its Testnet
Key Levels
Resistance Levels: $55.50, $52.50, $48.00
Support Levels: $43.00, $41.33, $39.50
 LTC/USD Daily Chart
On the daily chart, the price of LTC/USD attempted a break past the MA 200, which was acting as a strong resistance level since the prior week. The next resistance point is at $50. Since the collapse on 2nd September, Litecoin has largely oscillated within a descending pattern. LTC/USD lost upside momentum beneath the MA 200 to register an intraday low of $43.25 where it met stiff support which acted as a demand zone.
Bearing bullish implications, the move upwards might take a bit of time for Litecoin. In the meantime, the buyers may see the recent plunge as an opportunity to fill the $43-$50 price range. The bulls must now try to go beyond the $45 mark at the MA 200 zone to maintain a bullish bias. On the downside, the price is sitting on top of a healthy support level, so downside movement (for now) is somewhat limited.
 LTC/USD 4-Hour Chart
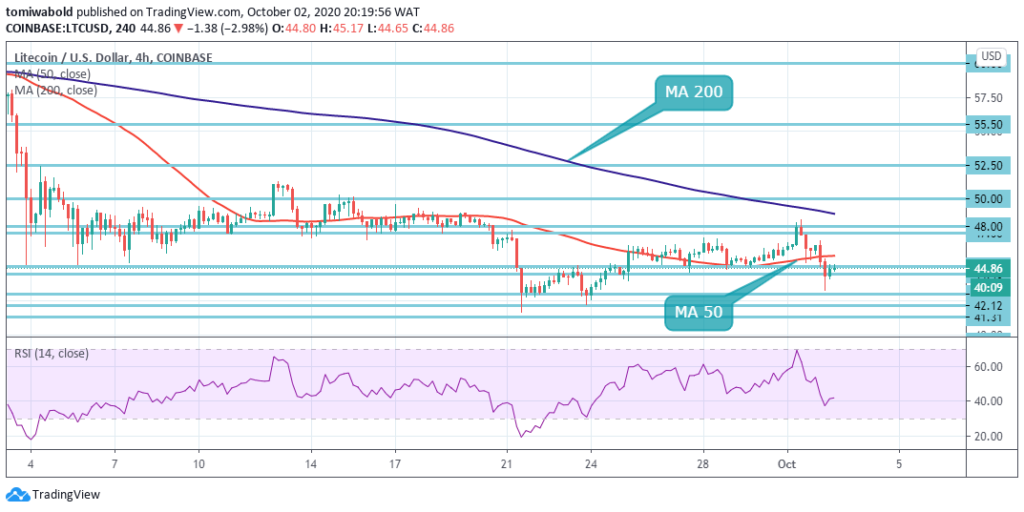
Although Litecoin is depicting a downtrend on the 4-hour chart with higher highs and higher lows, it is currently facing strong resistance at 4 hour MA 50 area. Another leg up until $48 is likely; while a rejection from $50 will push LTC down beneath the recent lows of $43.25 levels.
Meanwhile, the 4-hour chart RSI shows increasing bearish momentum, so overall sentiment in the chart remains bearish while trading under both MA 50 and MA 200. The LTC/USD pair is only bullish while trading above the $45 mark, key resistance is found at the $48 and the $50 levels. If the LTC/USD pair trades below the $43 level, sellers may test the $41.31 and $39.50 support levels.
Note: Kryptomoney.com is not a financial advisor. Do your research before investing your funds in any financial asset or presented product or event. We are not responsible for your investing results
Image Credit: Shutterstock
Keep in mind that we may receive commissions when you click our links and make purchases. However, this does not impact our reviews and comparisons. We try our best to keep things fair and balanced, in order to help you make the best choice for you.