The cryptocurrency market is generally in green, and so is Litecoin. BTC’s sharp rally to a $24,200 high seems to have put a bid under Litecoin. Litecoin (LTC) surged from the $78 support on Dec. 16 and followed up with another strong move on Dec. 17. This move pushed the price past the $100 psychological level. The fifth-largest cryptocurrency has since been on the move as a bullish leg on LTC/USD extends past $120. Litecoin is on fire, recording four straight days of bullish action. At the time of writing, LTC is exchanging hands at $121.98, up by 12.88% in the last 24 hours to set intraday highs of $122.64. Litecoin ranks among the top weekly gainers at a 57.05% increase. LTC’s present market cap stands at $7.95 billion with a 24-hour trading volume of $9.34 billion. Litecoin has hit its highest price since 2019 halving as it traded above $100. On 5th August 2019, Litecoin (LTC) had its second halving, which saw its block reward halved from 25 LTCs to 12.5 LTCs. At a speed of 2.5 minutes per block produced, halving occurs every 840,000th block or every 4 years.
*Litecoin is on fire, recording four straight days of bullish action
*LTC is exchanging hands at $121.98, up by 12.88% in the last 24 hours
*Litecoin has hit its highest price since 2019 halving as it traded above $100
Key Levels
Resistance Levels: $150.00, $140.05, $130.00
Support Levels: $100.00, $80.00, $51.00
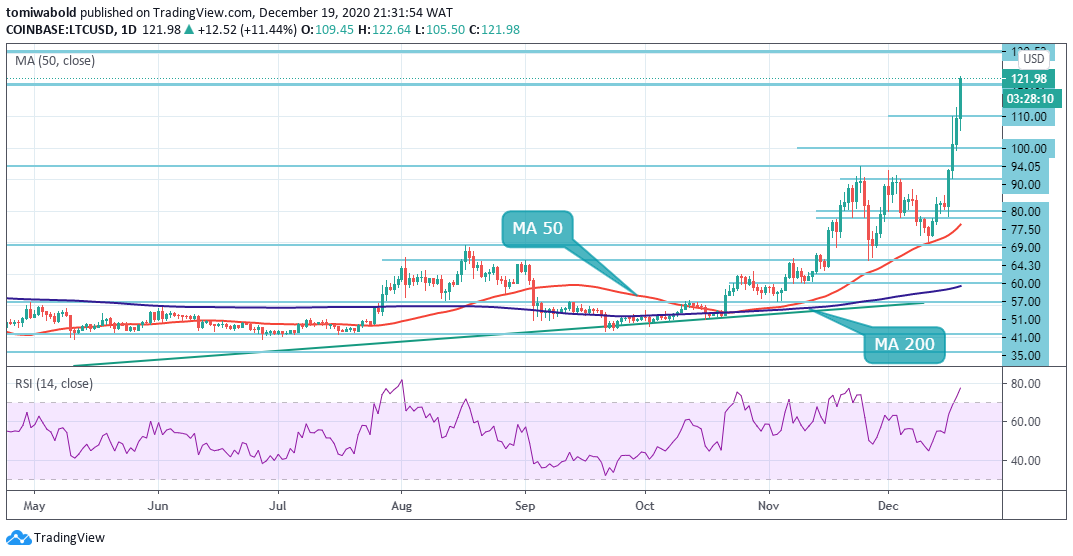 LTC/USD Daily Chart
A bullish formation on LTC/USD daily chart occurred after Litecoin spiked past the $94 resistance. On the upside, the path ahead of LTC seems to be relatively smooth however LTC may face some resistance at $130. Once this hurdle is out of the way and demand for LTC builds, a breakout with a $140 target may soon appear.
On the flip side, if exhaustion sets in on the part of the bulls and volume dwindle, the LTC/USD pair may retest the first major support level at $100. Increased selling pressure may cause LTC to correct to $94. LTC may need to refresh support at the $90 level to prevent further downside. If the price breaks below $90, the pair could drop to $80.
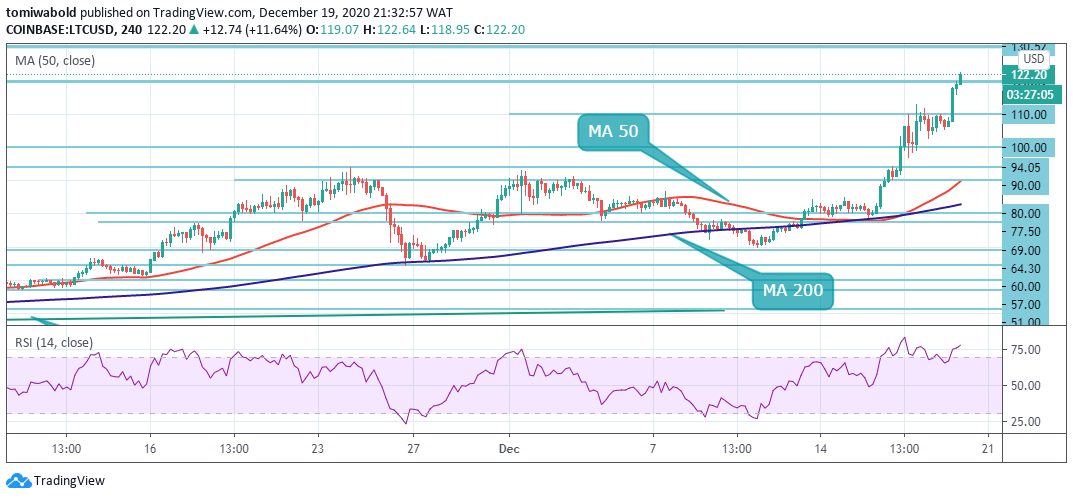 LTC/USD 4-Hour Chart
LTC is in bulls’ territory, the upsloping moving averages and the RSI towards 80 indicate bulls have the present advantage. A further push by the bulls may cause the $130 and $140 levels to come to bare. On the flip side, if the advantage shifts in favor of the bears, a price close below $110 may cause the LTC price to correct under $100.
Tentative support is envisaged at the $90 level. Further selling pressure will cause LTC to retest supports at the 4 hour MA 50 and MA 200, presently at $90 and $82 respectively. The LTC/USD pair is only bullish while trading above the $90.00 level, key resistance is found at the $130 and the $140 levels. If the LTC/USD pair trades below the $90.00, sellers may test the $80 and $51 support levels.
Note: Kryptomoney.com is not a financial advisor. Do your research before investing your funds in any financial asset or presented product or event. We are not responsible for your investing results
Image Credit: Shutterstock


Keep in mind that we may receive commissions when you click our links and make purchases. However, this does not impact our reviews and comparisons. We try our best to keep things fair and balanced, in order to help you make the best choice for you.