Cryptocurrencies are primarily green apart from some Altcoins in the market having a difficult time catching up with Bitcoin (BTC) bullish cycle. Litecoin (LTC) has been on a bullish rally as it went up from $57.12 to $66.66 in the past three days. During this recent rally, the buyers managed to flip the $60 level from resistance to support. In a drastic move, bulls pushed LTC price past the overhead resistance at $64 that was established in late August and tested three times. The LTC market cap is currently 7th on the Coinmarket cap table at $4.16 billion, with $3.38 million in exchange-traded volume over the past 24 hours. LTC is exchanging hands at $65.23 after setting intraday highs of $66.66. LTC is one of the daily gainers, up by 10.34% in the last 24 hours on the news that U.S Paypal users will now be able to buy, sell, and hold Litecoin. On Thursday, PayPal’s crypto trading and payments went live for all eligible customers in the U.S. The payment giant initially announced its plans to integrate cryptos like BTC, ETH, and LTC weeks ago.
*Litecoin has been on a bullish rally as it went up from $57.12 to $66.66 in the past three days
*In a drastic move, bulls pushed LTC price past the overhead resistance at $64 that was established in late August and tested three times
*LTC is one of the daily gainers, up by 10.34% in the last 24 hours on the news that U.S Paypal users will now be able to buy, sell and hold Litecoin
Key Levels
Resistance Levels: $78.00, $72.15, $69.00
Support Levels: $64, $60, $57
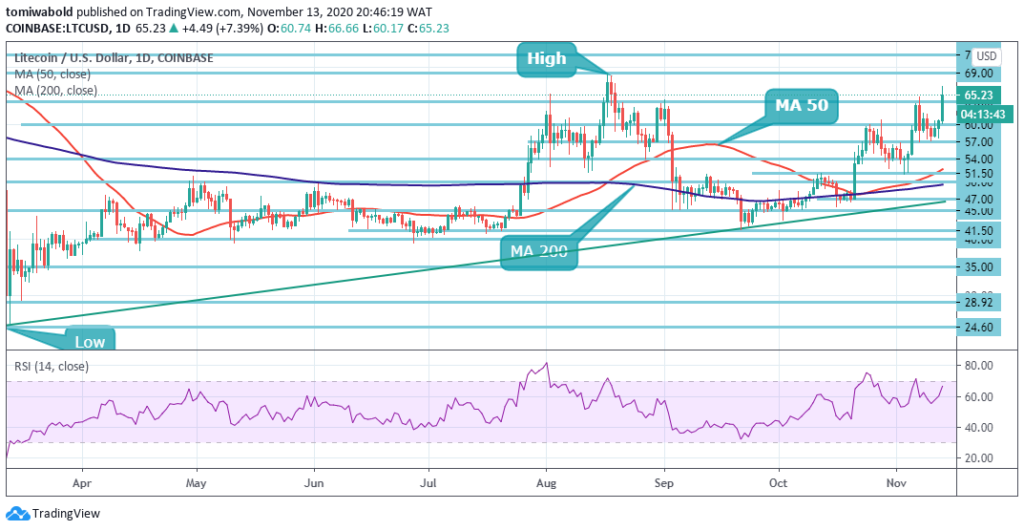 LTC/USD Daily Chart
As seen on the daily chart, LTC/USD saw a liftoff to $66 when it found and embraced support at $60. The mission among the bulls now is to sustain the breach of the key resistance at $64 in the near term considering LTC rejection from this key level on November 7th. If the buyers sustain past this wall, the price should reach $70.
On the downside, sellers will assume significant control over the asset if the price fails to hold above $64. Two healthy support lies at $60 and $57. A further breach beneath the $57 level may take the price down to $51.50 MA 50 area.
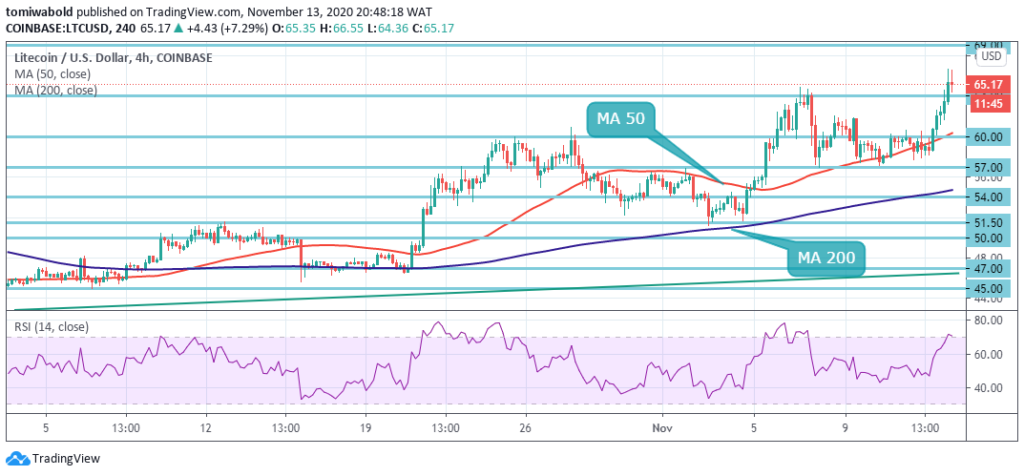 LTC/USD 4-Hour Chart
The 4-hour chart shows the sloping upwards moving averages and the RSI in the positive zone suggesting that bulls have the upper hand. Technical analysis shows that a bullish breakout from a large triangle pattern on the lower time frames is close to taking place. This advantage could shift in favor of the bears if the support at $60 gives way.
Such a move could cause the LTC/USD pair to test the $57 and $51 levels. Although while trading beyond the $60 mark, the LTC/USD pair is only bullish; the main resistance is found at the $69 and $72.15 level. If the LTC/USD pair is trading beneath $60, the $55 and 4 hour MA 200 zone and $45 support levels may be tested by sellers.
Note: Kryptomoney.com is not a financial advisor. Do your research before investing your funds in any financial asset or presented product or event. We are not responsible for your investing results
Image Credit: Shutterstock


Keep in mind that we may receive commissions when you click our links and make purchases. However, this does not impact our reviews and comparisons. We try our best to keep things fair and balanced, in order to help you make the best choice for you.