
After a sharp sell-off on Tuesday, June 2, Litecoin initiated a choppy recovery. It has witnessed a tremendous spike in the volume of trading on most exchanges lately. Litecoin is the seventh-largest digital currency with a recent $3 billion market capitalization, whilst daily trading volume is recorded at $2.7 billion. Litecoin (LTC) aims to revisit another rally to $50.00 early on Thursday but struggled to hold the momentum and fell to as low as $46.29 (low intraday). LTC/USD is trading at $47.68 at the time of writing and it’s up 1.36 percent in the last 24 hours, mostly unchanged daily. David Burkett, the MimbleWimble privacy protocol enthusiast, has released yet another monthly update with a definite progress plan for the next three months. While unveiling a structured Q2-Q3, 2020 framework, he disclosed September as the Testnet Release date.
*Litecoin (LTC) aims to revisit another rally to $50.00 early on Thursday
*LTC/USD is trading at $47.68 at the time of writing and its up 1.36 percent in the last 24 hours, mostly unchanged daily
*David Burkett, the MimbleWimble privacy protocol enthusiast, has released yet another monthly update with a definite progress plan for the next three months.
Key Levels
Resistance Levels: $64.00, $55.50, $48.00
Support Levels: $45.00, $39.50, $33.00
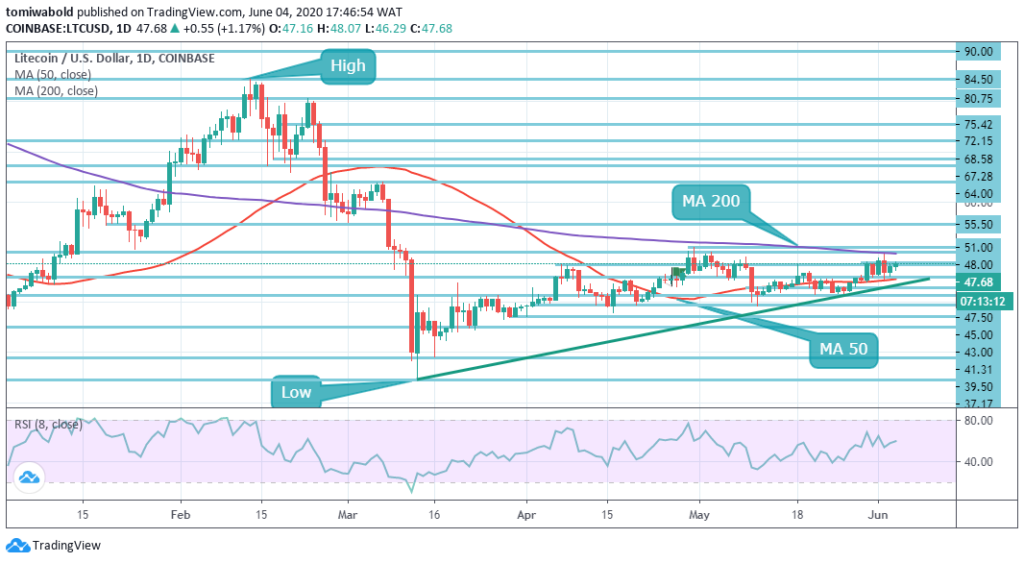 LTC/USD Daily Chart
Litecoin has initiated a bounce back following the wider crypto market after gaining strong technical support close to the MA 50 level around $45.00. A reversal trend has emerged on the lower time frame, and signals of a probable rally toward the $50.00 mark. Investors may consider that price needs to shift far beyond the resistance level of $48.00 to initiate the trend of the inverted head and shoulders.
From a technical point of view, the relative strength index moves beyond the 50 zones however there is an evident missing strength. The LTC/USD pair is just bullish whilst still exchanging beyond the level of $43.00, the main resistance is identified at levels of $48.00 and $50.00. When the LTC/USD pair sells beneath $43.00, then traders may test the support levels of $41.31 and $39.50.
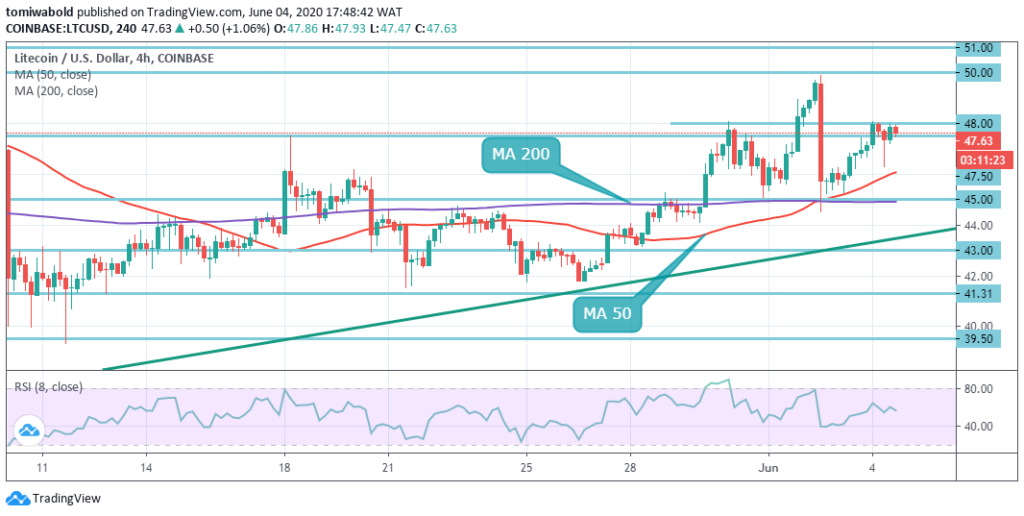 LTC/USD 4-Hour Chart
LTC/USD’s recent sell-off on the intraday chart was constrained by the local level of support established by a confluence of MA 50 and MA 200 at $45.00. Although the price attempts to hold over this region after the initial sell-off, a horizontal-sloping RSI implies that the sideways tendency on the market remains strong with unbroken ascending trendline support in place.
A continuous shift beneath this region may open the channel’s lower range at $43.00 and $41.30 next. Short-term resistance on the upside is established at $48.00, which is strengthened by both the intraday high and upper horizontal line. It is followed by a subsequent $49.60 high and next is the utmost high target of $50.00.
Note: Kryptomoney.com is not a financial advisor. Do your research before investing your funds in any financial asset or presented product or event. We are not responsible for your investing results
Image Credit: Shutterstock

Keep in mind that we may receive commissions when you click our links and make purchases. However, this does not impact our reviews and comparisons. We try our best to keep things fair and balanced, in order to help you make the best choice for you.