
The cryptocurrency market remains down on a 24-hour basis. At the time of writing, the majority of assets were seen trading in red, and Litecoin is no exception. At the time of writing, Litecoin was trading at $127, down by 6.97% in the last 24 hours and 19.61% weekly. Consolidation holds sway on LTC/USD as price awaits the next major move. Ranking 13th largest, Litecoin’s market capitalization stands at $8.4 billion and $1.87 billion in traded volume over 24 hours. Japan’s top financial regulator, the Financial Services Agency (FSA), announced last week that it has registered Coinbase as a crypto exchange service provider based on the revised Fund Settlement Act. The FSA then went on to approve Litecoin (LTC) as one of the five cryptocurrencies tradeable on Coinbase Japan.
Key Levels
Resistance Levels: $230, $190, $150
Support Levels: $105, $95, $70
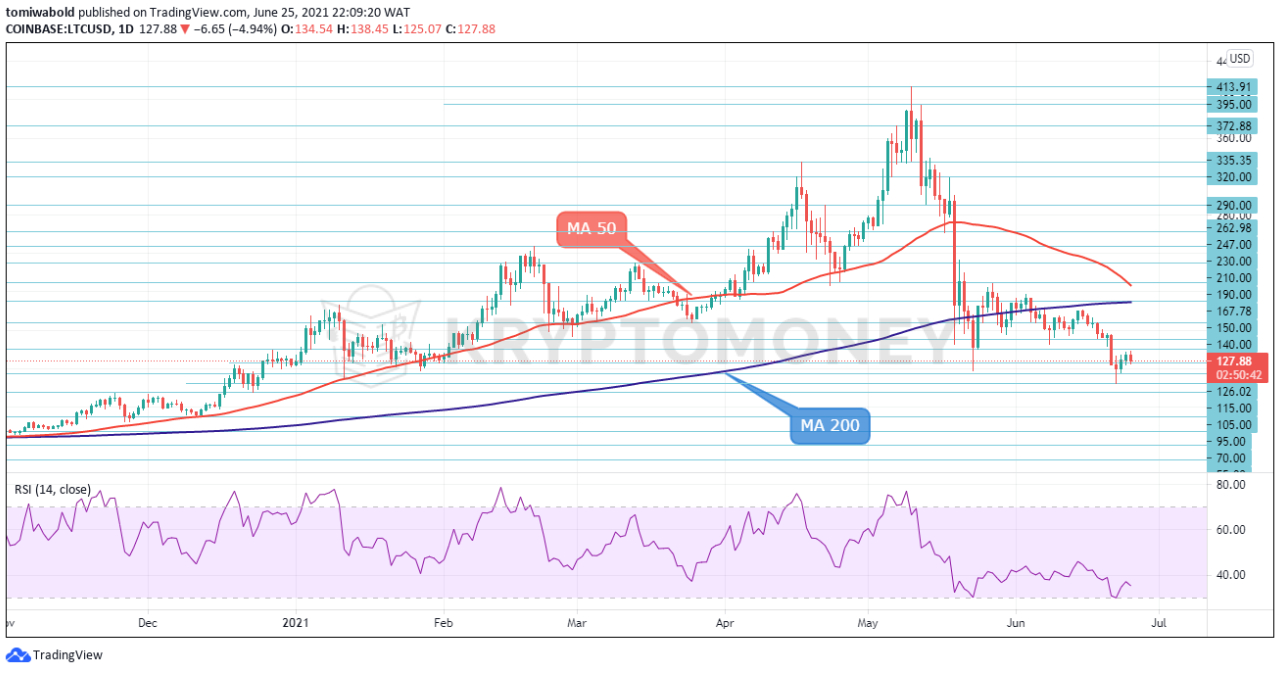 LTC/USD Daily Chart
Litecoin’s recent bounce from lows of $105 on June 22, after a retraction below the MA 200 ($189) seems to be curbed by the $138 barrier. A subsequent decline occurred on June 24 with lows formed at $125 and the price is now consolidating losses. Taking a glimpse at the short-term oscillators, it seems that positive momentum is struggling as the RSI remains below 50. Litecoin had entered into downside consolidation after declining from its yearly highs of $413 on May 10.
In the event of upside movements, the $155 level could act as a barrier before being able to re-challenge the MA 200 at $189. Successfully clearing this, the LTC/USD pair may then test the MA 50 ($206) and $339 level, before the $413 yearly high. On the contrary, in the event the decline extends underneath the $117 base, the bears may then challenge the $105 support boundary.
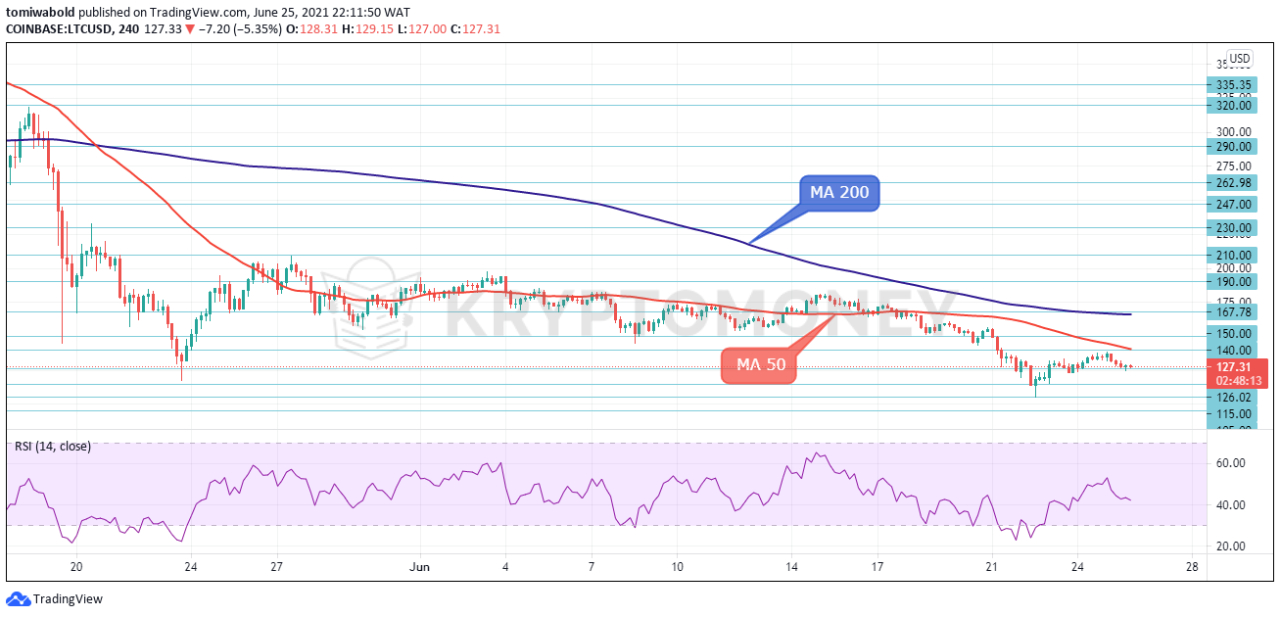 LTC/USD 4-Hour Chart
Litecoin posted a sideways movement after it topped at $413 on May 10. In the recent declines, LTC price fell beneath the MA 50 ($140) and MA 200 ($166) and now holds within the sub $130 range. The RSI has stabilized beneath the 50 levels indicating the absence of bullish impulse. More losses might push LTC price down to the $120 psychological barrier, before a dive to $105 lows.
Alternatively, LTC might bounce again to the upside, encountering resistance near moving averages 50 and 200 before heading up to the $338 level. The market could flirt with the yearly high at $413 if LTC breaks the aforementioned levels. In short, consolidation holds sway on the LTC/USD pair, a break either above the moving averages or below $125 will likely determine where the market goes next.
Note: Kryptomoney.com is not a financial advisor. Do your research before investing your funds in any financial asset or presented product or event. We are not responsible for your investing results
Image Credit: Shutterstock


Keep in mind that we may receive commissions when you click our links and make purchases. However, this does not impact our reviews and comparisons. We try our best to keep things fair and balanced, in order to help you make the best choice for you.