
Besides several other cryptocurrencies, Litecoin is grappling Wednesday under a selling trading action. The spot price for Litecoin (LTC) stays lower from its $50 May tops before Bitcoin halving. Today, the LTC market cap is seventh on the Coinmarketcap table at about $2.9 billion, with $3.4 billion in value over the past 24 hours. As at press time LTC/USD exchanged at $44.13 after a 3.00 percent decline from $46.20 (intraday high). Litecoin foundation partners Atari video game firm as a payment processor. Litecoin (LTC) is being authorized as a payment processor to buy the latest Atari VCS gaming console and to trade in the Atari token which will be released in September 2020. The announcement came on the heels of the partnership between the Litecoin Foundation and the legendary Atari videogame firm.
*As at press time LTC/USD exchanged at $44.13 after a 3.00 percent decline from $46.20 (intraday high)
*The spot price for the Litecoin (LTC) stays lower from its $50 May tops before Bitcoin halving
*Litecoin (LTC) is being authorized as a payment processor to buy the latest Atari VCS gaming console
Key levels
Resistance Levels: $55.50, $50.00, $45.00
Support Levels: $41.31, $37.17, $33.00
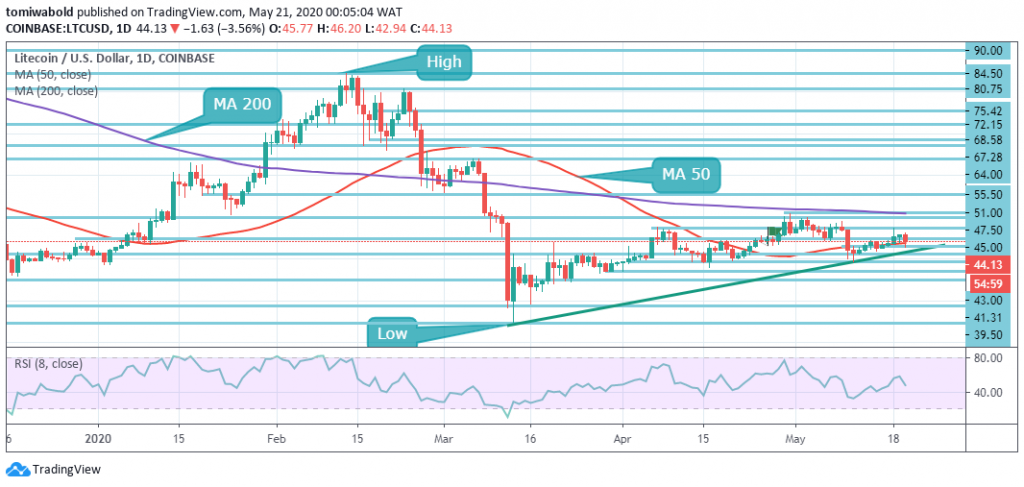 LTC/USD Daily Chart
The MA 50 and MA 200 remain bearishly crossed on the daily chart for the LTC/USD market, thus limiting a short moment of previous bull market volatility achieved in the first quarter. The MA 50 now stands at $44.13 beneath present market price but may, once breached, further serve as resistance in the near term.
Significant downward price action may lead in a further inflated shift, as the long positions may begin to untangle. This week, given the sudden bearish shifting from the $51.00 resistance area, Litecoin seems to be at risk of further potential losses. The technical analysis reveals that the LTC/USD pair may discover persistent weakness under the $45.00 mark as a bear market.
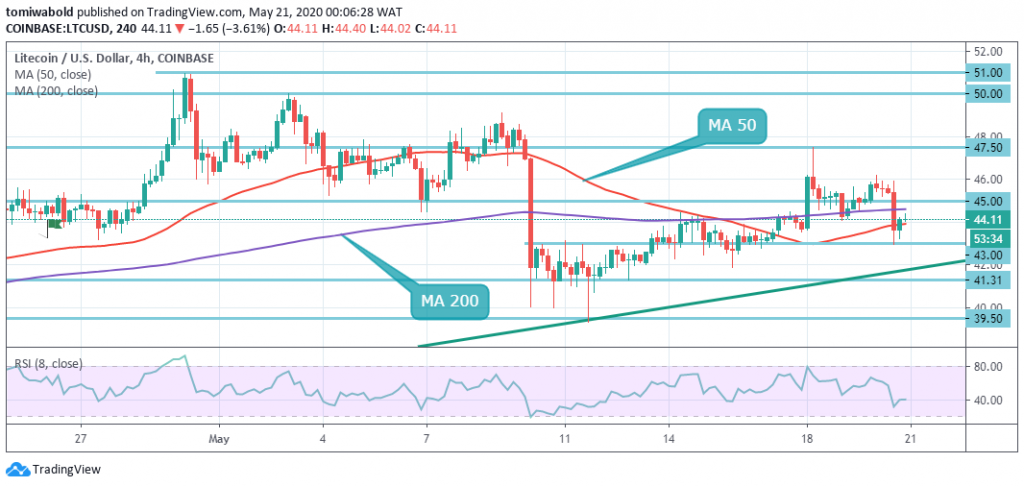 LTC/USD 4-Hour Chart
As seen in the short-term timeframe above, the price has fallen below the region of $45.00 and found some support just under $43.00. The area of $43.00 has been used several times in the past and is represented by the MA 50 red line on the 4-hour chart. Under the 50 mid-line, the Relative Strength Index indicator has dropped into a more bearish position, which may be a warning that more bearishness is coming.
One of the chart’s key features is the bounce off the ascending trendline support that connects to the recent low at $39.50. The LTC/USD pair is only bullish while trading beyond the level of $45.00, the main resistance is seen at levels between $47.50 and $50.00. Sellers may test the $41.31 and $39.50 support levels with the price of LTC/USD pair trading beneath $45.00.
Note: Kryptomoney.com is not a financial advisor. Do your research before investing your funds in any financial asset or presented product or event. We are not responsible for your investing results
Image Credit: Shutterstock


Keep in mind that we may receive commissions when you click our links and make purchases. However, this does not impact our reviews and comparisons. We try our best to keep things fair and balanced, in order to help you make the best choice for you.