Litecoin is the seventh-largest digital asset with a present $2.8 billion in market cap and an estimated $1.5 billion in daily trading volume. Litecoin (LTC) has been shifting within a narrow range since the beginning of the week. It’s been hard to achieve gains beyond $45 in the last week. LTC/USD slumped to lows at $41.75 earlier in the week. However, Litecoin has a median transaction value of $50, in this case, the most realistic ‘average’ is its median value. The token trades at $43.00, mostly unchanged from the start of the day as well as on a day-to-day basis, while the short-term bias stays bearish. Litecoin’s Core developer Loshan has announced the launch of Litecoin Lightning Network Daemon (lndltc) v0.10.1 beta. Lndltc is an open-source Lighting Network Implementation. ‘Lightning Labs’ developed it. The version allows for larger payments from Litecoin ‘as well as more efficient payment routing.’
*It’s been hard to achieve gains beyond $45 in the last week. LTC/USD slumped to lows at $41.75 earlier in the week
*However, Litecoin has a median transaction value of $50, in this case, the most realistic ‘average’ is its median value
*Litecoin’s Core developer Loshan has announced the launch of Litecoin Lightning Network Daemon (lndltc) v0.10.1 beta
Key Levels
Resistance Levels: $55.50, $50.00, $45
Support Levels: $42.12, $39.50, $37.17
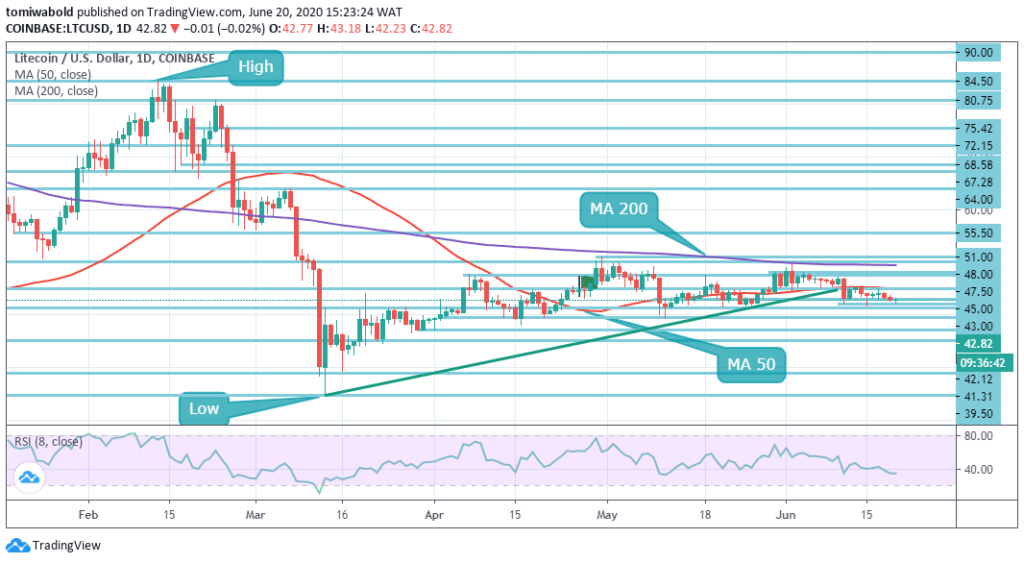 LTC/USD Daily Chart
On the daily chart, LTC/USD has deteriorated from $45.00 beneath the MA 50 towards the downside and the lower horizontal support boundary at $42.12. To determine the further course of prices, a stable push beyond this range is needed. The token had reached the bottom on June 15 at $41.75 and has since risen beyond $43.00. However, for now, seemingly the upside momentum is constrained. The range-bound scenario is backed by the flat RSI on the daily chart.
The MA 200 is beyond price, and in the long term may work as resistance. Price analysis on Litecoin reveals that a rally beyond the level of $45.00 might see the LTC/USD pair testing towards the level of $50.00. Likewise, there are presently no significant bullish or bearish divergences on RSI. All in all, sellers who have lately struggled to hold the price beneath the $42.12 support may see the LTC/USD return beyond the $50.00 level.
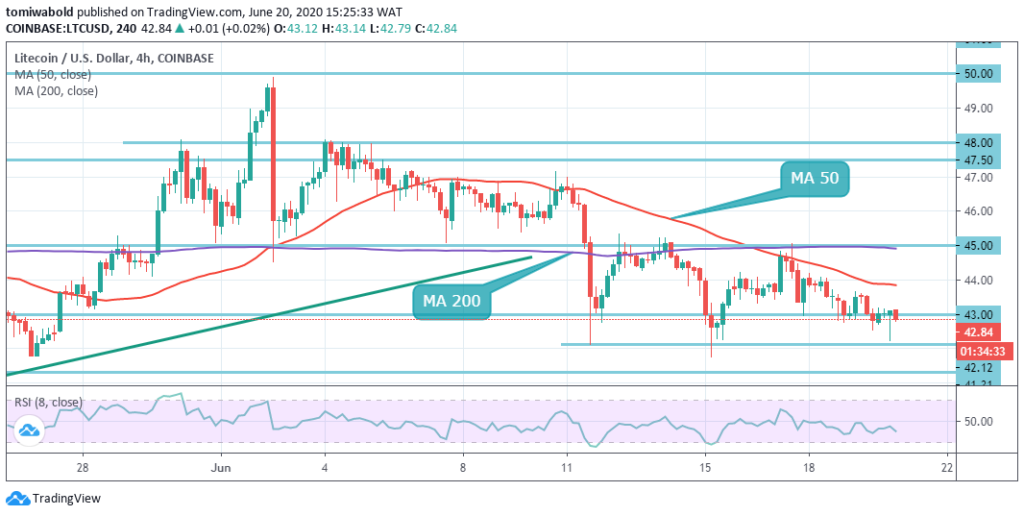 LTC/USD 4-Hour Chart
Litecoin is trapped on the short-term trend beneath the MA 50 as the Bitcoin and the larger crypto-currency market lack a clear price trend. To enable short-term technical buying, LTC/USD bulls have to push prices beyond the $45.00 resistance level. The shorter context for the LTC/USD pair suggests a breakout from a price range of $45.00 to $50.00 is required to establish a new trend.
The LTC/USD pair is just bullish while trading beyond the level of $45.00, key resistance is discovered at levels of $50.00 and $55.00. Once the LTC/USD pair trades beneath the $45.00 level, sellers may test the support levels of $39.50 and $37.17. Watch out for short-term gains beyond the short-term level of $45.00 to prompt technical buying toward the level of $55.00.
Note: Kryptomoney.com is not a financial advisor. Do your research before investing your funds in any financial asset or presented product or event. We are not responsible for your investing results
Image Credit: Shutterstock


Keep in mind that we may receive commissions when you click our links and make purchases. However, this does not impact our reviews and comparisons. We try our best to keep things fair and balanced, in order to help you make the best choice for you.