
The crypto market is mostly in the buy zone as BTC traded briefly at $60k. Litecoin extends recovery above the MA 50 ($197) into the second consecutive day. Litecoin is continuing the rebound off the ascending trendline, overcoming the MA 50 at $197 and moving towards $220. However, a break above $208 is required to sideline bears. At the time of writing, Litecoin was consolidating gains at $206, up by 3.89% in the last 24 hours and 16.42% weekly. With a present market valuation of $13.8 billion, Litecoin has been able to reclaim the 9th spot in the cryptocurrency market cap ranking. Litecoin price rose after fake rebranding to Bitcoin Lite. April Fools’ was almost over when Litecoin creator Charlie Lee made a fake announcement via Twitter claiming that Litecoin would be rebranded to Bitcoin Lite, “as Satoshi Nakamoto intended.” On Mar. 30, PayPal announced that it will let U.S users pay with cryptocurrencies, Litecoin inclusive.
*Litecoin extends recovery above the MA 50 into second consecutive day
*Litecoin was consolidating gains at $206, up by 3.89% in the last 24 hours and 16.42% weekly
*Charlie Lee made a fake announcement via Twitter claiming that Litecoin would be rebranded to Bitcoin Lite
Key Levels
Resistance Levels: $230, $220, $208
Support Levels: $200, $190, $180
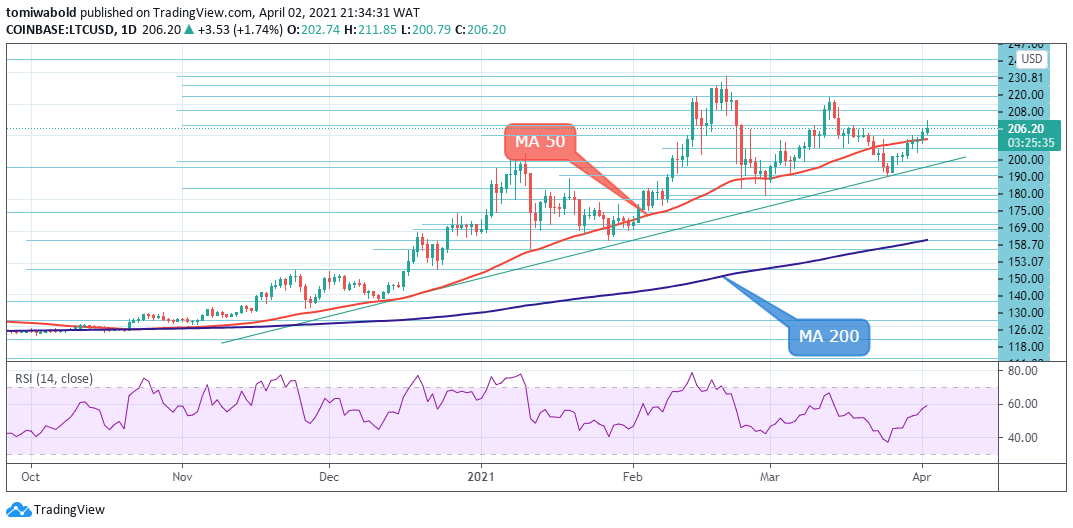 LTC/USD Daily Chart
Litecoin bounced off the ascending trendline support on Mar. 25 after declines to lows of $167. Since then, LTC saw green candles for 7 consecutive days as it climbed steadily. The soaring moving averages are safeguarding the positive structure while the RSI is just at the 60 Level. If buying interest persists, initial constraints could arise from the nearby resistance at $208. Litecoin confirmed resistance at this level on three counts since late February.
However, surpassing this barrier may bolster upwards efforts, pushing the pair towards a $230 obstacle. Another leg higher could then challenge the resistance at the $247 yearly high. If sellers resurface and steer the price down, preliminary support may come from the MA 50 support at $197. Piloting lower, the pair may encounter downside friction from the $180 psychological level before the price hits the supportive ascending trendline.
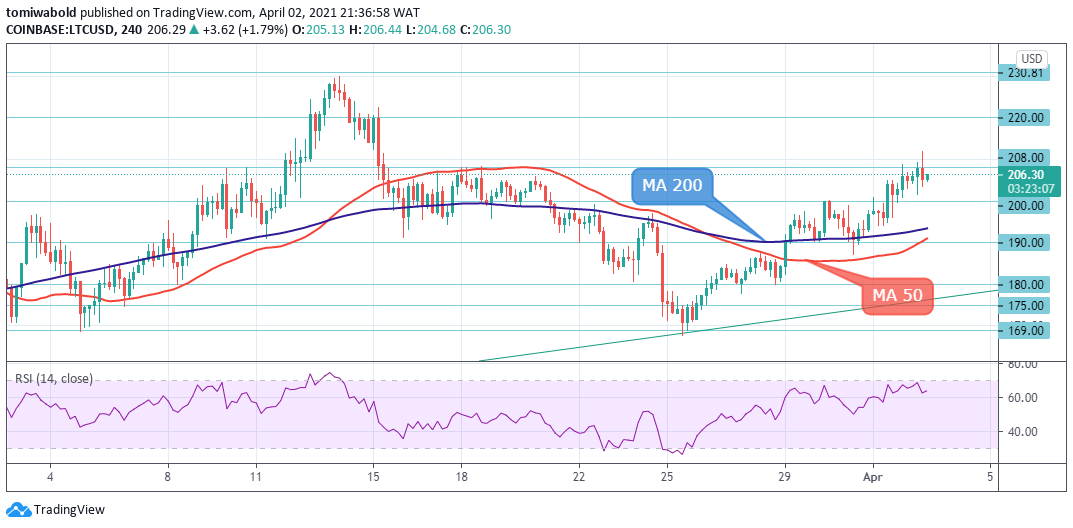 LTC/USD 4-Hour Chart
The short-term oscillators are favoring the improving picture as the RSI hovers near 70. On the upside, the bulls are likely to gain strength if there is a clear break above the $208 and $220 levels. The next major resistance on the upside is at the $230 level and the yearly high at $247. On the downside, supports are forming above the confluence of the MA 50 and 200.
Should the price sink further below this mark, sellers may then target the support at $179 and $176. In the event, this support fails to offer some footing for buyers, the ascending trendline support underneath may attempt to annul the price decline. Overall the LTC/USD is trading in a range before and an eventual breakout higher.
Note: Kryptomoney.com is not a financial advisor. Do your research before investing your funds in any financial asset or presented product or event. We are not responsible for your investing results
Image Credit: Shutterstock


Keep in mind that we may receive commissions when you click our links and make purchases. However, this does not impact our reviews and comparisons. We try our best to keep things fair and balanced, in order to help you make the best choice for you.
