
Litecoin is seeing a surprising rebound of late. At the time of publication, Litecoin was changing hands at $60, marginally up in the last 24 hours and down 5.19% in the last seven days, according to CoinMarketCap data. Since its creation more than ten years ago, Litecoin has indeed come a long way. This year, Litecoin added optional privacy features via soft fork through the MWEB (MimbleWimble extension block) upgrade. As Litecoin turns 11, a tweet posted by the Litecoin foundation reveals it has processed over 133 million transactions without any downtime. An earlier tweet also indicated that Litecoin mining difficulty is also at new highs nearing 19 million hashes. According to the Litecoin Foundation, the ming difficulty remains an important metric for mining and might suggest how the Litecoin network controls new coin issuance.
Key Levels
Resistance Levels: $85.00, $75.00, $65.00
Support Levels: $50.00, $40.00, $30.00
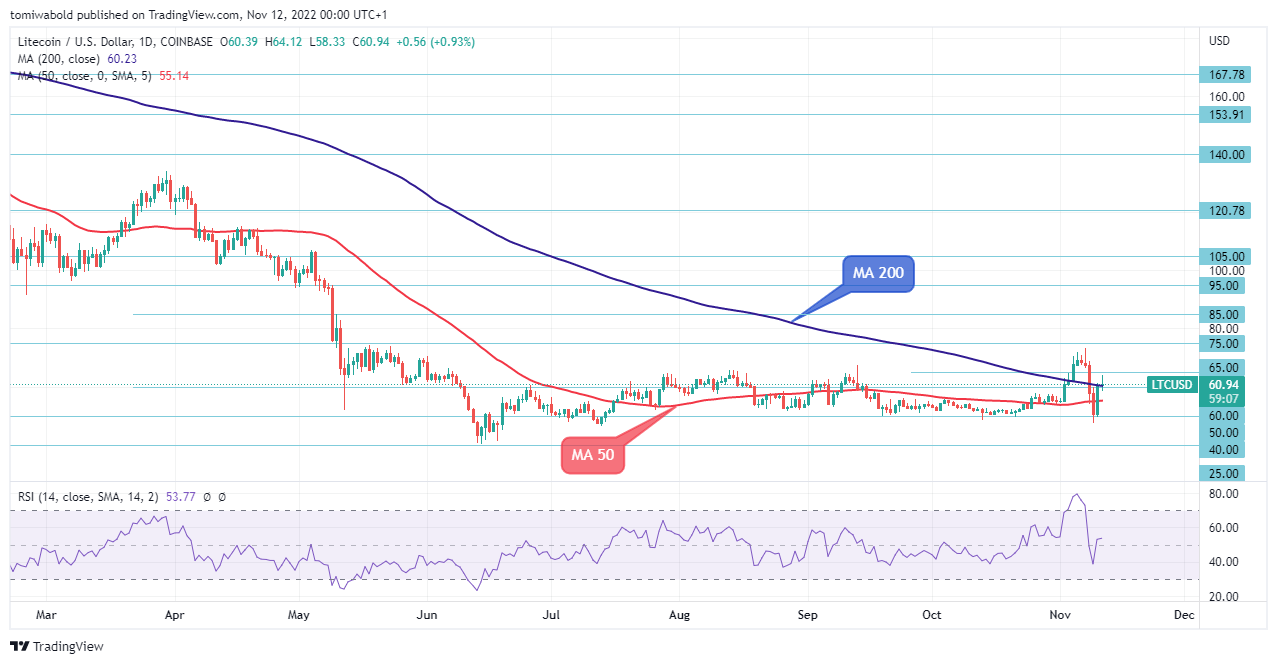 LTC/USD Daily Chart
After easing to $47.50 lows on Thursday, the LTC/USD pair rebounds around the $40.53 zones during the following session with market action turning upwards. Meanwhile, the upbeat market mood helps LTC limit its downside despite its weakness. LTC/USD rebounds from lows to reach the $64.12 level while adding to recovery moves ahead of the week’s close
Even so, the pair remains inside the range established since the May crash. While strong RSI conditions favor the pairs’ latest bounce off horizontal support at $60.00, the recovery moves will have a bumpy road considering the horizontal barrier at the $75.00 level. Hence, Litecoin buyers may remain worried unless breaking the immediate resistance line, at the $65.00 level.
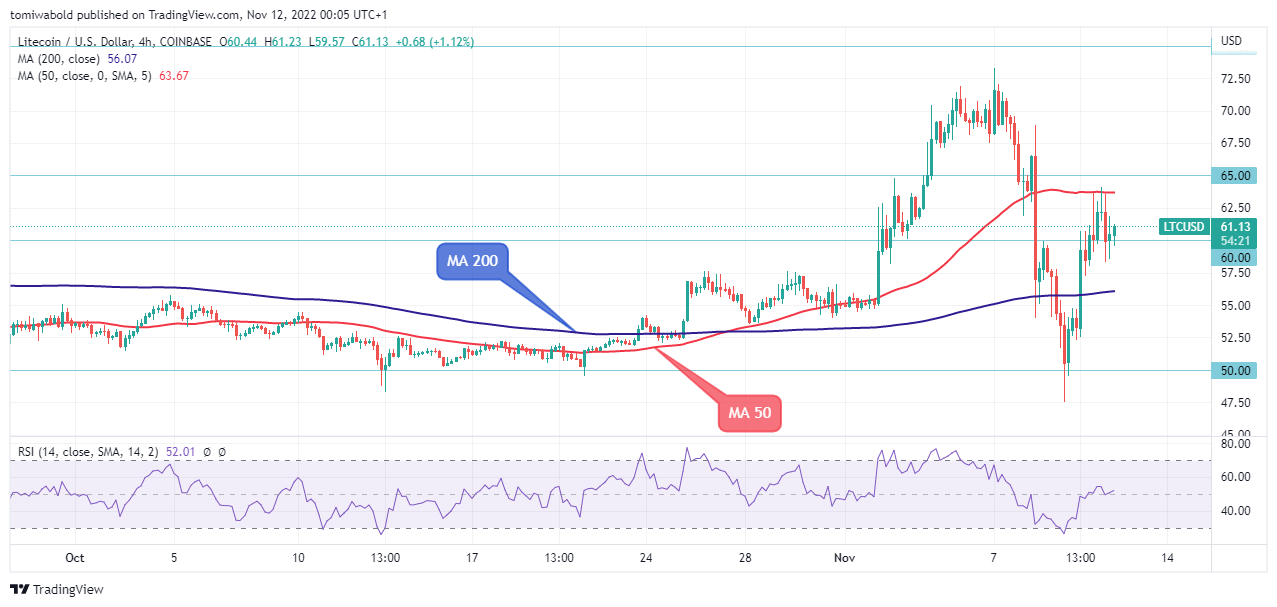 LTC/USD 4-Hour Chart
LTC/USD is still holding below the temporary high of $73.29 level, despite the week’s rebound. Intraday bias stays primarily neutral. If the rebound continues to the upside, the bullish potential could be capped by the 4-hour moving average (MA 50) at $63.50 zones, leading to a fresh decline.
On the other hand, a breakout of the $65.00 level could launch a larger uptrend with a major run from the $60.00 zone to the $65.00 level next. However, the resistance cluster formed around $0.75.00 could limit the price of LTC in the short term.
Note: Kryptomoney.com is not a financial advisor. Do your research before investing your funds in any financial asset or presented product or event. We are not responsible for your investing results
Image Credit: Shutterstock


Keep in mind that we may receive commissions when you click our links and make purchases. However, this does not impact our reviews and comparisons. We try our best to keep things fair and balanced, in order to help you make the best choice for you.
