
The cryptocurrency market is a sea of red apart from a few selected Altcoins. After attaining a peak of $186 on January 10, Litecoin faces an uphill task capped by key resistance above $160. A recovery kickstarted on Jan. 22 to highs of $147 however the bulls lost the tenacity to push for further gains, leading to a collapse. Amid the declines, LTC/USD bulls defend the support at $127 while aiming for further upside gains. At the time of writing, Litecoin is trading down at $134, having lost 8.61% on the daily and 18.81% on the weekly. Ranking 8th on the Coinmarketcap table, LTC’s market valuation stands at $8.69 billion with a 24-hour trading volume of $6.17 billion. Institutional demand for cryptocurrencies is rising significantly in 2021 as seen in Grayscale’s purchase of 10,234 Litecoin and other digital assets, BTC and Altcoins inclusive. Recent data from crypto analytics firm Bybt.com indicated that Grayscale has accelerated its holding of Altcoins with the recent purchases.
*Litecoin faces an uphill task capped by key resistance above $160
*Litecoin is trading down at $134, having lost 8.61% on the daily and 18.81% on the weekly
*Institutional demand for cryptocurrencies is rising significantly in 2021 as seen in Grayscale’s purchase of 10,234 Litecoin
Key Levels
Resistance Levels: $200.00, $175.00, $150.00
Support Levels: $130.00, $111.00, $95.00
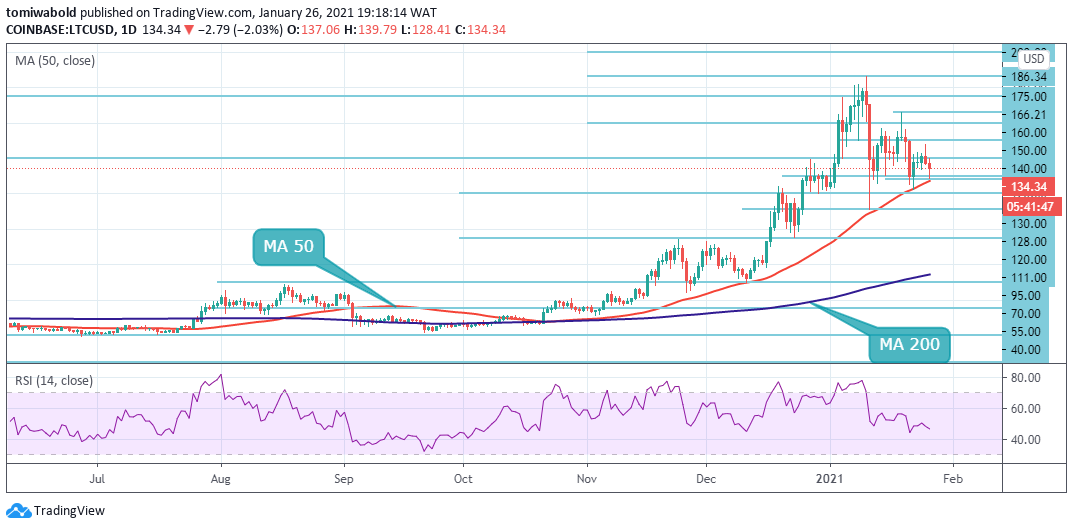 LTC/USD Daily Chart
As seen on the daily chart, Litecoin (LTC) bounced off the MA 50 support on Jan. 22 to trade to highs of $147 before another downside move. Presently, bulls are working assiduously to defend the MA 50 support at $127 with LTC depending on this critical support to hold. If they succeed, the LTC/USD pair may rise past the resistance range at $150-$175 and then retest the $186 high. A breakout of this level could resume the uptrend.
On the contrary, if the price turns down from current levels, the bears will continue their push to break the MA 50 support at $127. If they succeed, a downside move that may pull LTC price beneath $111 and then to the MA 200 located at $75 may occur. Otherwise, the LTC/USD pair may enter into consolidation before the next trending move.
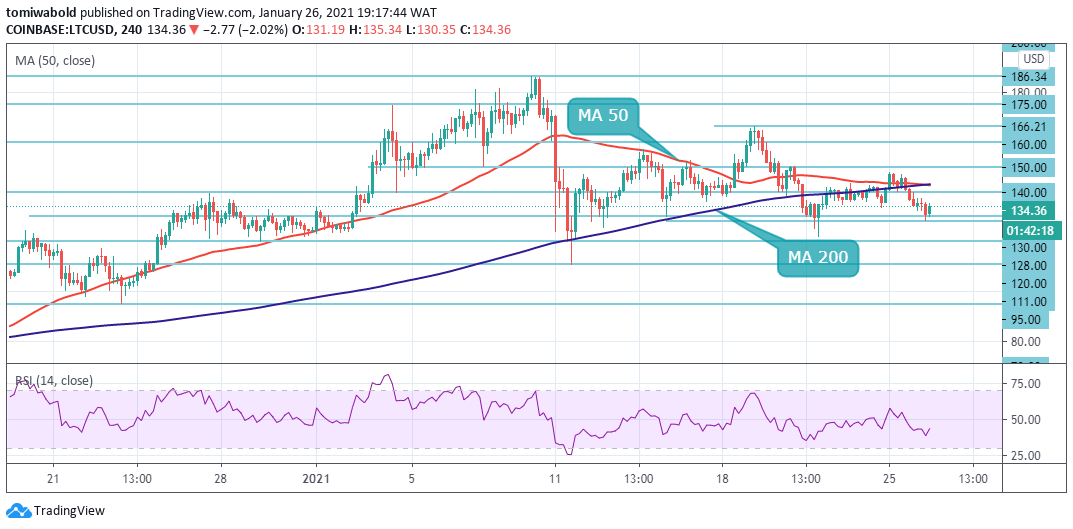 LTC/USD 4-Hour Chart
On the 4-hour time frame, LTC lost the support at the MA 50 and 200 on Jan.11. Bulls’ attempt to reclaim these support levels was thwarted by the resistance above $160. The mission among the bulls now is to trade past the $147 high mark which will bring upside gains past $160 and $190 to the fore.
On the contrary, failure to move past the $133 support level would bring the first major support level at $128 into play. Barring another extended sell-off, Litecoin should steer clear of sub $111 levels. The LTC/USD pair is only bullish while trading above the $140 mark, key resistance is found at the $150 and the $175 levels.
Note: Kryptomoney.com is not a financial advisor. Do your research before investing your funds in any financial asset or presented product or event. We are not responsible for your investing results
Image Credit: Shutterstock


Keep in mind that we may receive commissions when you click our links and make purchases. However, this does not impact our reviews and comparisons. We try our best to keep things fair and balanced, in order to help you make the best choice for you.