
The Altcoin market witnessed profit-taking in the early hours of the day while BTC rode on to highs near $57k. Litecoin bounced off from March 5 lows of $169 and proceeded to rally to $208 before the uptrend lost steam. After four straight days of bullish action, the recent rejection at $208 gives bears leeway to launch an assault on lower support levels. While LTC/USD bulls fight to reclaim upside move past $200, Litecoin seems to have found support at $190. At the time of writing, Litecoin is consolidating gains at $198, up by 6.27% weekly. Ranking 9th largest, LTC’s market valuation stands at $13.1 billion with a 24-hour trading volume of $5.56 billion. MW core developer David Burkett has stated that the code for Litecoin’s MimbleWimble upgrade will be ready by March 15th. MimbleWimble has been running on the Testnet for 3 months. On the set date, the code to the MWEB protocol will be ready for final review and formal auditing.
*The recent rejection at $208 gives bears leeway to launch an assault on lower support levels
*Litecoin is consolidating gains at $198, up by 6.27% weekly
*Code for Litecoin’s MimbleWimble upgrade will be ready by March 15th
Key Levels
Resistance Levels: $260, $247.00, $230.00
Support Levels: $190.00, $175.00, $153.00
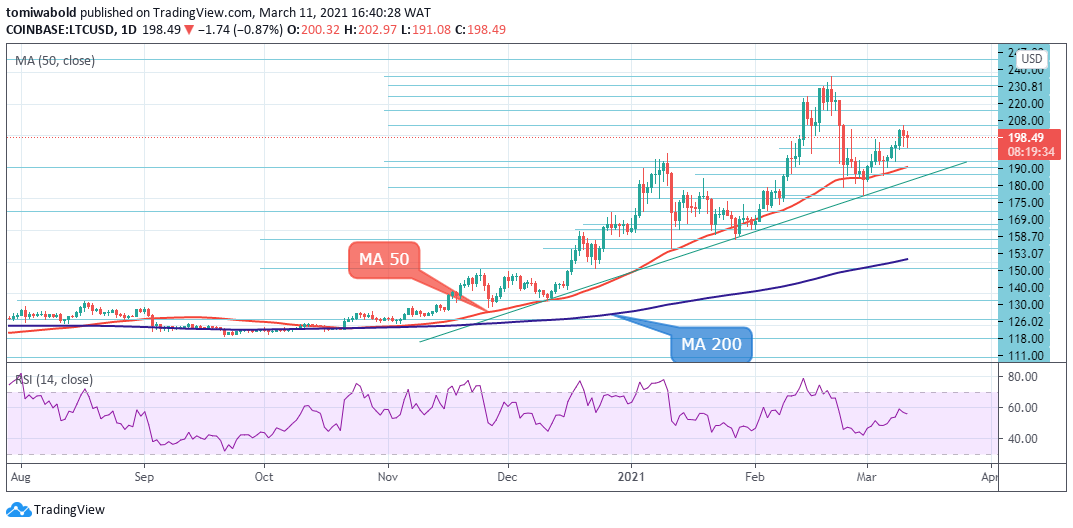 LTC/USD Daily Chart
Litecoin rebounded from the daily MA 50 on Mar. 5 and climbed to highs of $208. A downside break ensued to lows of $191 where the bulls stepped in. A further retest of lows at $191 on March 11th confirms support at this key level. The upsloping moving averages and the RSI in positive territory suggest an advantage to the bulls. A sustained breach past the barrier at $208 can cause LTC price to rally to $227 and then to the yearly high at $247.
On the other hand, the bears are unlikely to throw in the towel soon, If the price turns down from current levels, the MA 50 at $175 will act as a cap for further downside risk. A sustained break below this level will deepen the correction. In this case, Litecoin will be forced to revisit support at $153.
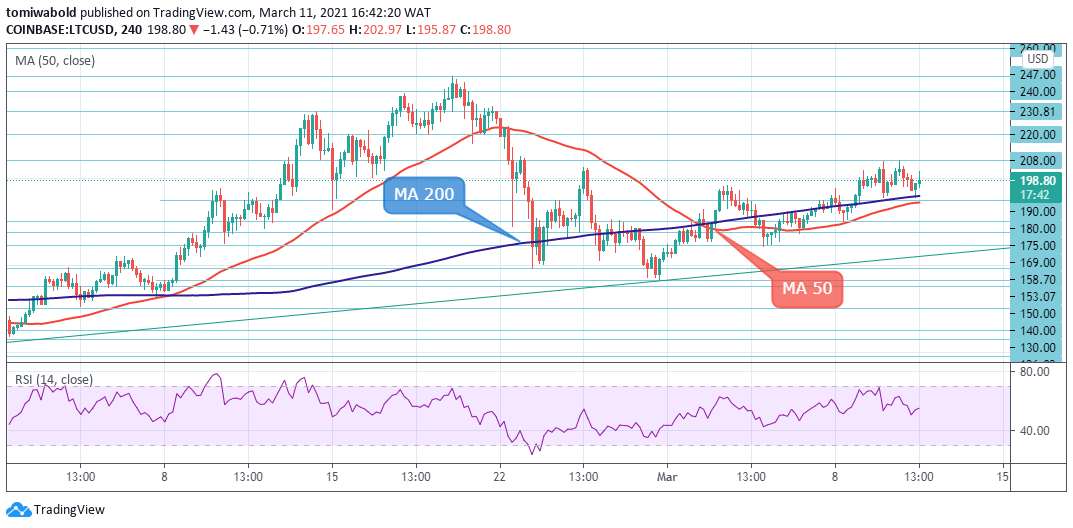 LTC/USD 4-Hour Chart
Litecoin is presently consolidating above the 4 hour MA 200 support at $191. The RSI indicator on the 4-hour chart is above midline implying a rather indecisive market for now. Should the LTC/USD pair find fresh buying orders, a breakout past $208 may be on the cards. Litecoin may then aim for $223 which capped the pair’s ascent on the 22nd Feb. On an ultimate bullish scenario, Litecoin may ultimately target the yearly high at $247.
On the flip side, Litecoin sits on top of a robust support range between $188 and $192 which coincides with the MA 50 and 200 respectively. On the off chance, further selling interest is displayed, Litecoin may revisit support at $153. The LTC/USD pair is only bullish while trading above the $190 mark, key resistance is found at the $208 and the $220 levels.
Note: Kryptomoney.com is not a financial advisor. Do your research before investing your funds in any financial asset or presented product or event. We are not responsible for your investing results
Image Credit: Shutterstock


Keep in mind that we may receive commissions when you click our links and make purchases. However, this does not impact our reviews and comparisons. We try our best to keep things fair and balanced, in order to help you make the best choice for you.