
The crypto market is mostly bullish except for some selected DeFi tokens. BTC is trading past $52k while the majority of Altcoins are riding higher. Litecoin has staged an impressive performance in the ongoing bull run, trading to a multi-year high of $239 on Feb. 18. This move brings Litecoin within 38% of its December 2017 all-time high of $375, according to Coinmarketcap data. After a bear and bull tussle on reaching highs of $239, LTC/USD consolidates at multi-year highs while hunting for higher support. Ranking 8th largest, LTC’s market valuation stands at $15.4 billion with a 24-hour trading volume of $7.12 billion. Following a rebound from lows of $220 on Feb. 18, Litecoin is exchanging hands at $229. The digital asset is up by 3.86% in the last 24 hours and 23.81% on a 7-day basis. Grayscale Investments Holdings has increased its Litecoin trust holdings by 740%. Grayscale Litecoin Trust Holdings now houses 1.39 million LTC which translates to $328.56 million worth. The recent increase of the Litecoin Trust Holdings by Grayscale is a bullish signal that could see Litecoin sustain its uptrend to new all-time highs.
*Litecoin traded to a multi-year high of $239 on Feb. 18
*Litecoin is exchanging hands at $229, up by 3.86% in the last 24 hours and 23.81% on a 7-day basis
*The recent increase of the Litecoin Trust Holdings by Grayscale is a bullish signal
Key Levels
Resistance Levels: $270, $250.00, $240.00
Support Levels: $220.00, $200.00, $185.00
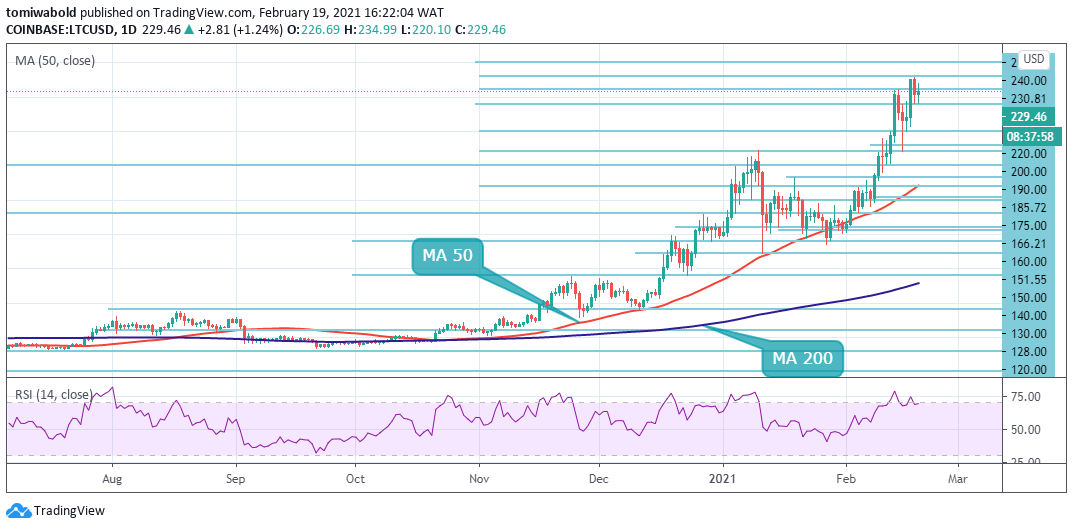 LTC/USD Daily Chart
As seen on the daily chart, Litecoin (LTC) is forming an inside day candlestick pattern which might signal indecision among traders about the next directional move. If the uncertainty resolves to the upside and the bulls drive the price above the $239 resistance, the LTC/USD pair could rally to $250 and then $270. The upsloping moving averages and the RSI in the overbought zone may suggest an advantage to the bulls.
On the contrary, failure to avoid a fall beneath $230 would bring the first major support level at $220 into play. The LTC/USD pair may then enter consolidation with the lower range falling to $185. LTC’s bullish outlook will invalidate if the asset turns down and breaks below $185, LTC may be forced to revisit support at the MA 50 ($160).
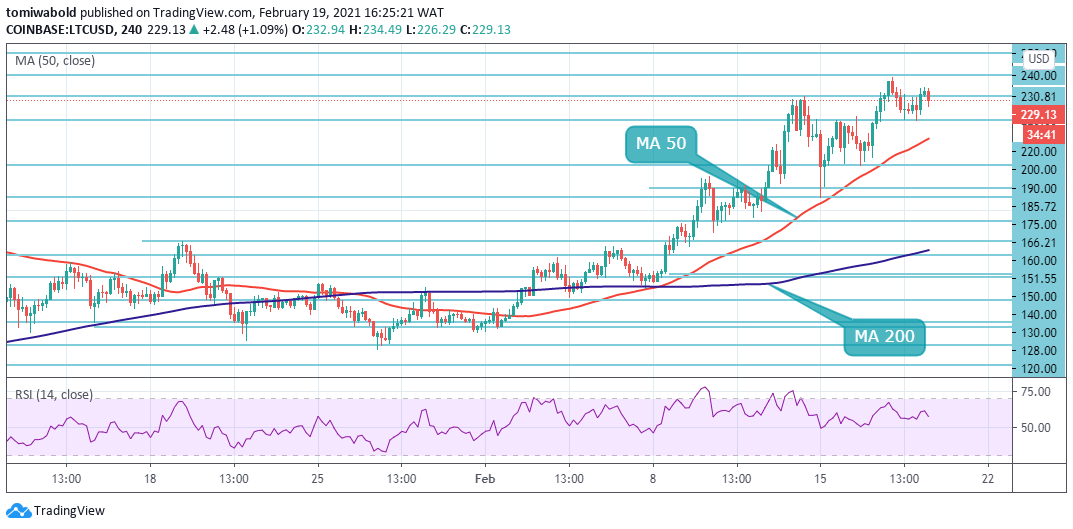 LTC/USD 4-Hour Chart
The technical picture on the 4-hour chart shows LTC trying to sustain its breach above the barrier at $230. LTC is trading within the confines of an ascending channel buoyed by the MA 50 support. A break past the $230 resistance range is likely to catapult LTC to $300 before making advances toward $400.
On the contrary, support above $220 is critical to the uptrend, because if lost, the correction may deepen towards the 4 hour MA 50 support at $212. Further declines may cause LTC to retest support at the MA 200 ($162). The LTC/USD pair is only bullish while trading above the $212 mark, key resistance is found at the $240 and the $250 levels.
Note: Kryptomoney.com is not a financial advisor. Do your research before investing your funds in any financial asset or presented product or event. We are not responsible for your investing results
Image Credit: Shutterstock


Keep in mind that we may receive commissions when you click our links and make purchases. However, this does not impact our reviews and comparisons. We try our best to keep things fair and balanced, in order to help you make the best choice for you.