The cryptocurrency market is bullish again after a short term correction in the prior week. Alongside other major cryptocurrencies, Litecoin bulls made a comeback after recovery ensued when it bounced off the support at $64. LTC went ahead to build upon the numerous support levels above $70 to sustain gains to $80. LTC/USD gears up for a bullish strike at $100 as a break above its current level is likely to catapult it towards the much-coveted price. At the time of writing, LTC is exchanging hands at $85.65. Although LTC is down by 5.79% on a 7-day basis due to the setback it suffered, it ranks among the top daily gainers at 11.13%. LTC’s present market cap stands at $5.45 billion with a trading volume of $5.54 billion in the past 24 hours. Famous U.S.based pizza chain, Pizzahut to accept Litecoin for payments in all its stores in Venezuela. In a recent tweet from CryptoBuyer, customers can now purchase pizza, food, and drinks at the restaurant chain with cryptocurrencies, Litecoin (LTC) inclusive.
*Litecoin bulls made a comeback after recovery ensued when it bounced off the support at $64
*At the time of writing, LTC is exchanging hands at $85.65
*Famous U.S. based pizza chain, Pizzahut to accept Litecoin for payments in all its stores in Venezuela
Key Levels
Resistance Levels: $100.00, $94.05, $90.00
Support Levels: $80.00, $69.00, $60.00
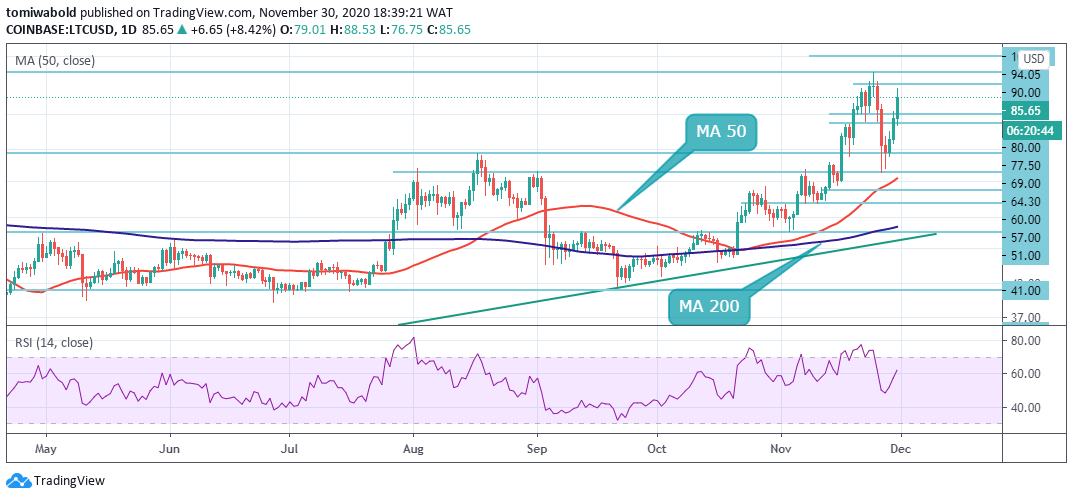 LTC/USD Daily Chart
As seen on the daily chart, Litecoin bulls made a comeback as seen in three straight days of bullish action since Nov.27th. Above its present price, key resistance is seen at $95 which stalled the LTC uptrend on November 24th. With enough buying pressure, LTC could then further its uptrend to $100.
On the downside, if the price rejects above its current level, a buyer congestion zone from $69 to $77.50 may prevent further declines. If the bulls squander their advantage, bears’ attempt to sink LTC price may be foiled at $64 from which a rebound occurred in the prior week. Further declines beneath $64.30 may cause LTC to retest the MA 50 at $63, below which may suggest a bearish comeback.
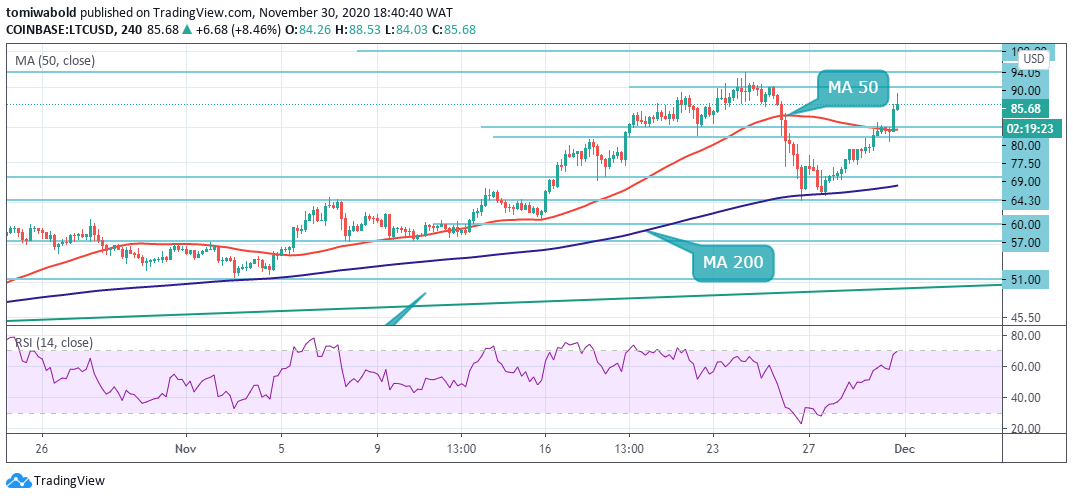 LTC/USD 4-Hour Chart
LTC made a decent recovery following a bounce off the 4 hour MA 200 support at $65. Attempts to keep LTC price capped under the 4 hour MA 50 at $79.35 was strongly rebuffed by the bulls. The main resistance lies ahead at $94.05 which stalled the uptrend previously. on the flipside, immense selling pressure may cause LTC to test the MA 50 and MA 200 located at $79.35 and $67.29 respectively.
Technical analysis indicates that LTC/USD bulls may buy into a price dip towards the $69 support level in anticipation of another rally. Traders that are bearish towards the LTC/USD pair may sell the pair in expectation of a major sell-off towards the $60 support region. Meanwhile, the LTC/USD stays bullish beyond the $70 mark in the short term trend.
Note: Kryptomoney.com is not a financial advisor. Do your research before investing your funds in any financial asset or presented product or event. We are not responsible for your investing results
Image Credit: Shutterstock


Keep in mind that we may receive commissions when you click our links and make purchases. However, this does not impact our reviews and comparisons. We try our best to keep things fair and balanced, in order to help you make the best choice for you.