
Amid optimistic fundamental changes, Litecoin has been gaining a foothold. The 10th cryptocurrency is poised to break out from its current range and continue towards its February 2020 peak of $84.50. LTC/USD rebounded from the local support at $45 and retested the channel resistance at $50 amid improved market sentiments. Despite formidable barriers ahead, price edges higher as LTC/USD breaks $50 with bulls becoming exhausted. The LTC market cap is currently 10th on the Coinmarketcap table at $3.23 billion, with $2.77 billion in exchange-traded volume over the past 24 hours. Near term optimistic outlook is confirmed by on-chain metrics as the amount of LTC kept on the cryptocurrency exchanges hot wallets has been steadily declining. The removal of coins for long-term storage from exchange wallets is an indication that the sentiments of the market are turning bullish.
*LTC/USD rebounded from the local support at $45 and retested the channel resistance at $50 amid improved market sentiments
*Despite formidable barriers ahead, price edges higher as LTC/USD breaks $50 with bulls becoming exhausted
*On-chain metrics confirm near term positive outlook as the number of ETH held on the hot wallets of the cryptocurrency exchanges has been trending down
Key Levels
Resistance Levels: $60.00, $54.00, $50.00
Support Levels: $45.00, $42.12, $40.00
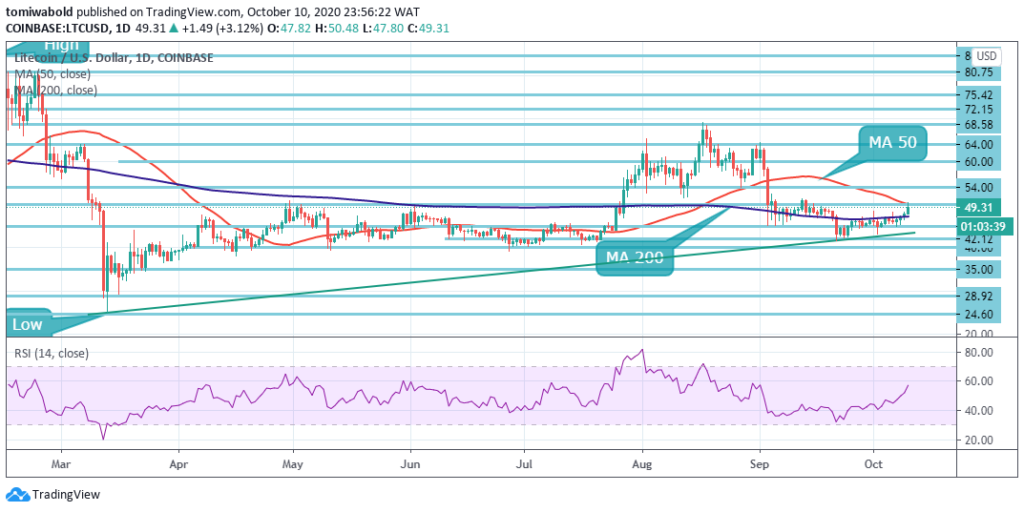 LTC/USD Daily Chart
As seen on the daily chart, buyers of Litecoin (LTC/USD) confront some exhaustion at the $50 level after the steady progress for 4 days in a row. A solid convergence of the bearish MA 50 is the resistance zone. Only a substantial breach beyond the specified level may expedite the recent gains to $54 on the next important barrier.
The Relative Strength Index (RSI) is firmer beyond the midline, having left more gains in range. It may, nevertheless, be difficult for the bulls to expand their dominance. As the direction of least resistance technically lies beneath. Besides that, the intersection of MA 50 and MA 200 could chart a death cross to the downside but might serve as strong support beyond the $45 mark.
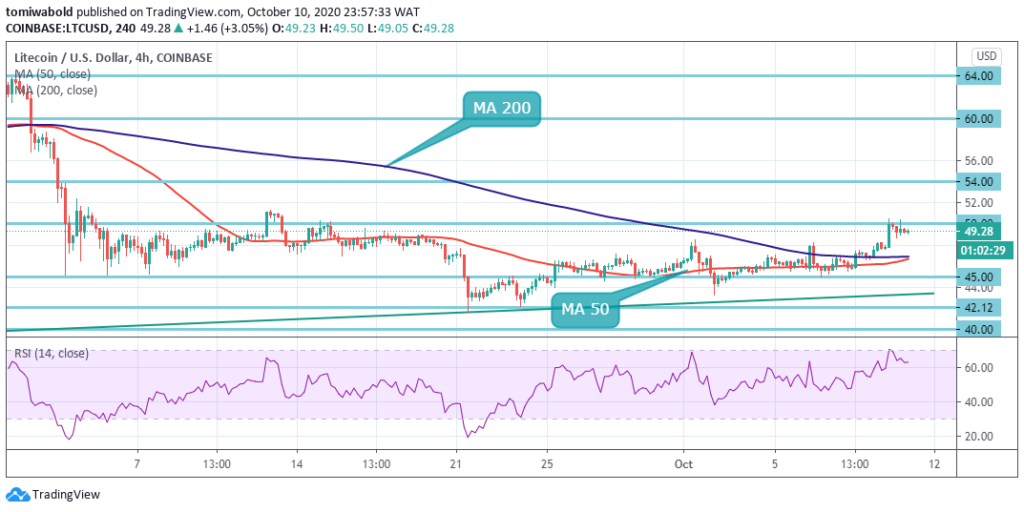 LTC/USD 4-Hour Chart
After dip potential buyers stepped in from the $45 support area during the week, Litecoin trades beyond the 4 hour MA 50 and MA 200. Technical analysis suggests that if bulls can conquer the level of resistance of $50, then the LTC/USD pair might rally to the level of $54. To the downside, the inability to surpass the level of $50 may lead to a substantial sell-off towards the level of $42.
Litecoin (LTC/USD) is not left behind, as it now trades near the monthly highs of $50.48, amid a wide recovery seen across the crypto markets over the past week. If trading beyond the $45 mark, the LTC/USD pair is only bullish; the main resistance is seen at the $50 and $54 levels. If the LTC/USD pair trades beneath $45, the $42 and $40 support levels may be tested by the sellers.
Note: Kryptomoney.com is not a financial advisor. Do your research before investing your funds in any financial asset or presented product or event. We are not responsible for your investing results
Image Credit: Shutterstock


Keep in mind that we may receive commissions when you click our links and make purchases. However, this does not impact our reviews and comparisons. We try our best to keep things fair and balanced, in order to help you make the best choice for you.