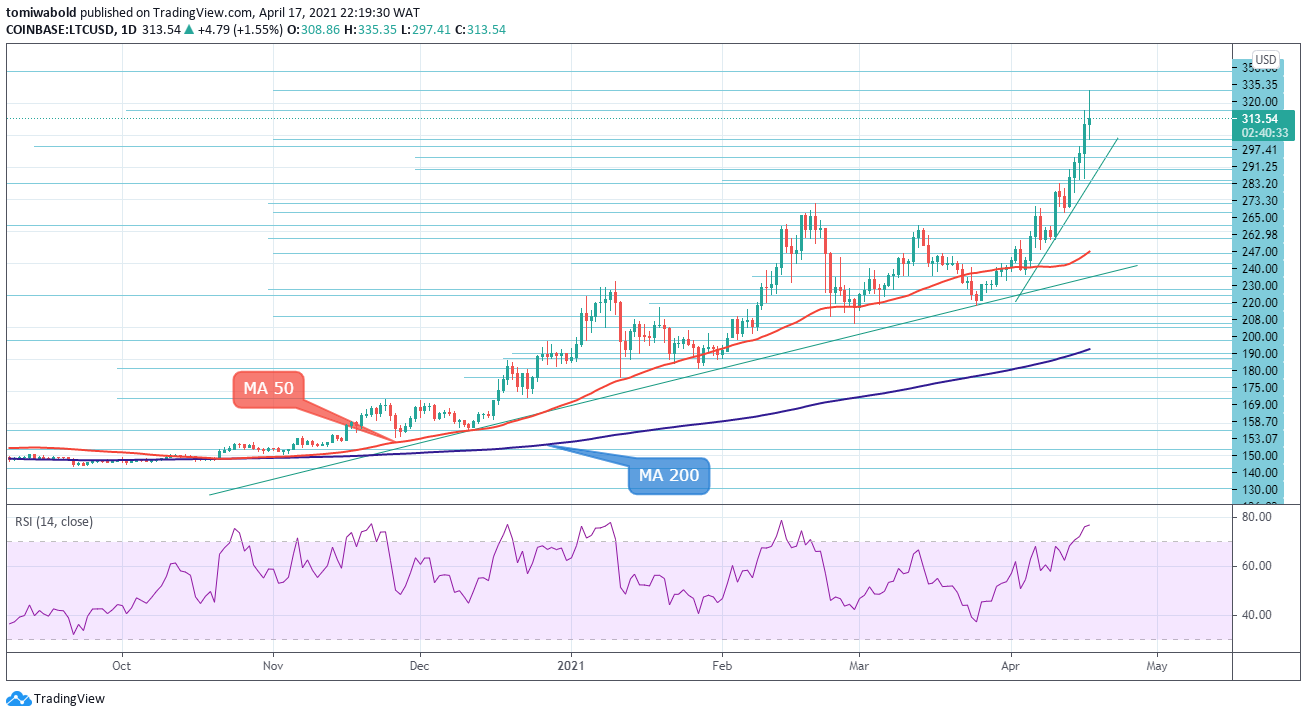
Litecoin (LTC) has established a new high of $335 on April 17 and bulls aim for more now. The digital asset had a brief consolidation period in the last 24 hours but could be aiming for the next leg up soon. LTC/USD rose to 5 days high on Saturday, gaining 3.50% for the day in an extension of Friday’s advance. Fresh strength generated a bullish signal on LTC and eventual break above the $300 barrier in the prior day that confirmed the continuation of the upside run. Rising positive momentum on the daily chart and moving averages (MA 50) in the bullish setup support the action, as the token is on course for the next bullish biggest weekly advance since mid-December. Litecoin (LTC) has had a bullish April and the market cap now stands at $20.88 billion, with $13.65 billion traded on exchanges in the past 24 hours. The London-based ETC Group, which was credited for the first crypto exchange-traded product to be listed on Germany’s Xetra digital stock exchange, has unveiled a new Litecoin listing. The ETC Group announced on April 14 that its physical Litecoin exchange-traded crypto, known as ELTC, would be unveiled on Deutsche Börse Xetra.
*LTC/USD rose to 5 days high on Saturday, gaining 3.50% for the day in an extension of Friday’s advance
*Fresh strength generated bullish signal on LTC and eventual break above $300 barrier in the prior day
*The London-based ETC Group has unveiled a new Litecoin listing
Key Levels
Resistance Levels: $400, $370, $350
Support Levels: $300, $270, $240
 LTC/USD Daily Chart
From an opening price of $308, LTC/USD rose to fresh yearly highs of $335.35; however, the $350 psychological zone continues to attract bullish action. A sustained break above $335 could lead to a rally to $340 and a high of $350. If the high at $335 is broken, the uptrend will resume. On the other hand, if the price falls due to the high turning to resistance, it might signal a potential consolidation between $300 and $335.
LTC/USD could retest the $265 support at the former bearish zone around the April 11 high if selling pressure builds. Once this gives way, the bulls will be able to rely on support at the $240 zone. A break below $240 would invalidate the LTC bullish outlook where further bearish action is likely to push to the daily moving average (MA 50) at $210 level. An extended move up is likely as the market has the power to break the order block and advance above $335.
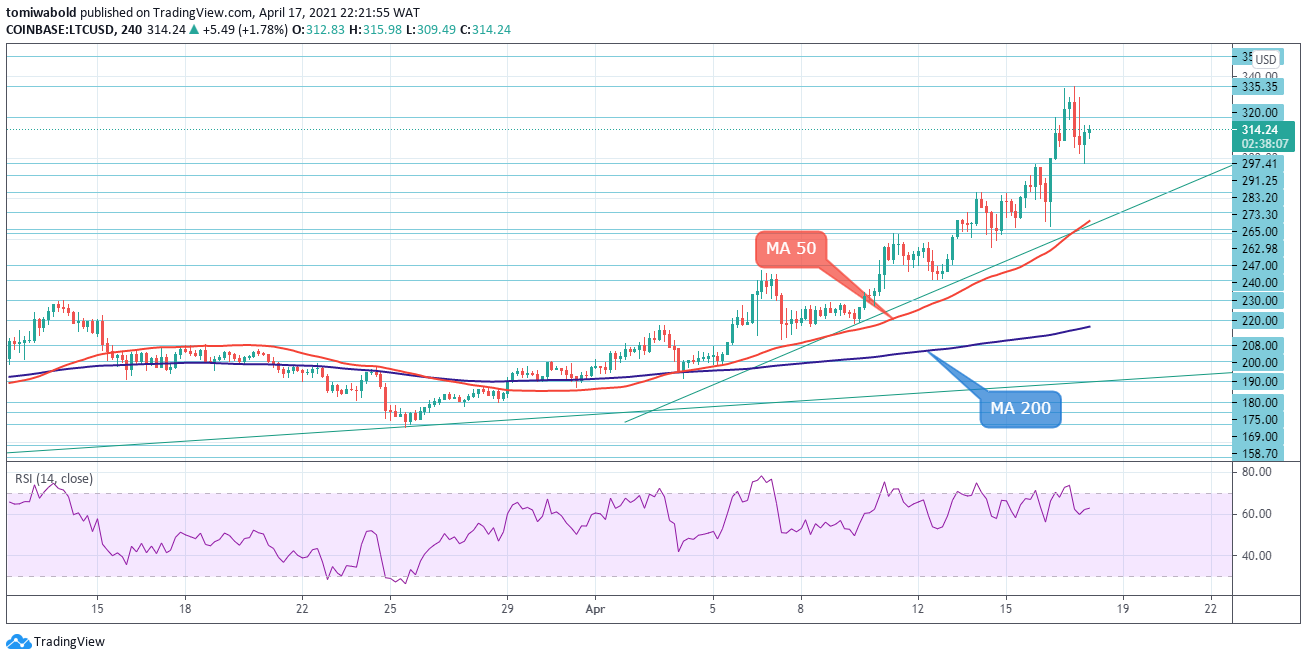
 LTC/USD 4-Hour Chart
The price of Litecoin is consolidating gains above the MA 50 around the ascending trendline at $270 levels, which served as a lift-off zone for its upward movement in the prior day. A resistance level has developed near $335 fresh yearly high, and a strong break above this level could lead to a drive towards $340 and $350 levels.
On the downside, initial support can be found around the $265 level. The next big support level may be in the $250 to $240 range (under the MA 50). The $265 mark serves as a level of intermediate support. Due to unexpected intense selling pressure, a break below $265 could invalidate the bullish outlook and expose the Altcoin to a correction towards $240. Only when the LTC/USD pair is trading above $265 is it considered bullish.
Note: Kryptomoney.com is not a financial advisor. Do your research before investing your funds in any financial asset or presented product or event. We are not responsible for your investing results
Image Credit: Shutterstock
Keep in mind that we may receive commissions when you click our links and make purchases. However, this does not impact our reviews and comparisons. We try our best to keep things fair and balanced, in order to help you make the best choice for you.