
The cryptocurrency market is a mixed pattern of red and green. BTC retreated from highs above $39k pulling some Altcoins alongside it. Litecoin was not spared the ax as it sliced through the support at $150 and retested the buyer congestion at $130. Litecoin bulls are gasping for air downstream as steep correction ensues on LTC/USD. Litecoin price formed a near-term top at $186 on January 10th before declining. Although LTC recovered briefly to trade back at $156 on 14th January, the bulls however lost the tenacity to pursue further upside gains. At the time of writing, Litecoin is trading down at $138, having lost 8.47% on the daily and 20% on the weekly. LTC’s present market cap stands at $9.31 billion with a 24-hour trading volume of $8.17 billion. Flare Networks announces Litecoin airdrop while revealing its plans to integrate with LTC ahead of its launch in Q2. Hugo Philion, CEO of Flare Networks, explained that the rest of the Spark (FLR) tokens to be received by the Flare Foundation after XRP airdrop will now be reduced by five billion tokens to be distributed to Litecoin holders.
*Litecoin price formed a near-term top at $186 on January 10th
*LTC is trading down at $138, having lost 8.47% on the daily and 20% on the weekly
*Flare Networks announces Litecoin airdrop while revealing its plans to integrate with LTC ahead of its launch in Q2
Key Levels
Resistance Levels: $200.00, $175.00, $150.00
Support Levels: $130.00, $111.00, $95.00
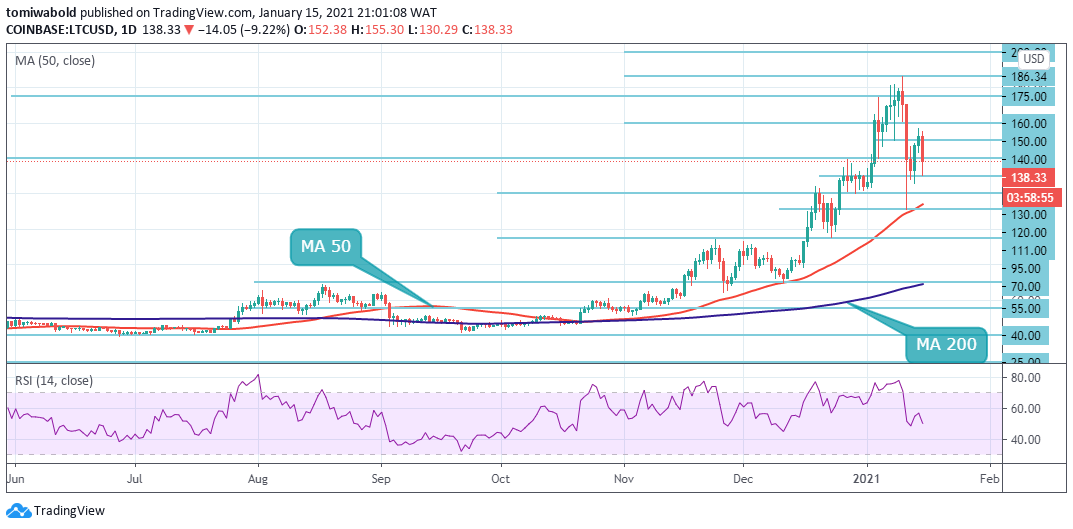 LTC/USD Daily Chart
A relief rally occurred on LTC/USD after its downside move beneath the $186 high. On January 15th, the LTC rally stalled short at $155 intraday highs as the bears hijacked the price action. Profit booking by short term traders pulled LTC price to intraday lows of $130. If buying is sustained at lower levels, the bulls will once again try to push the price past $150.
If they succeed, the LTC/USD pair may move up to $160 and then to $180. On the contrary, if the bears successfully defend the $150 resistance level, there could be another pullback. Initial support is seen near the $130 level. Any further losses may send the price towards the $120 support in the coming sessions.
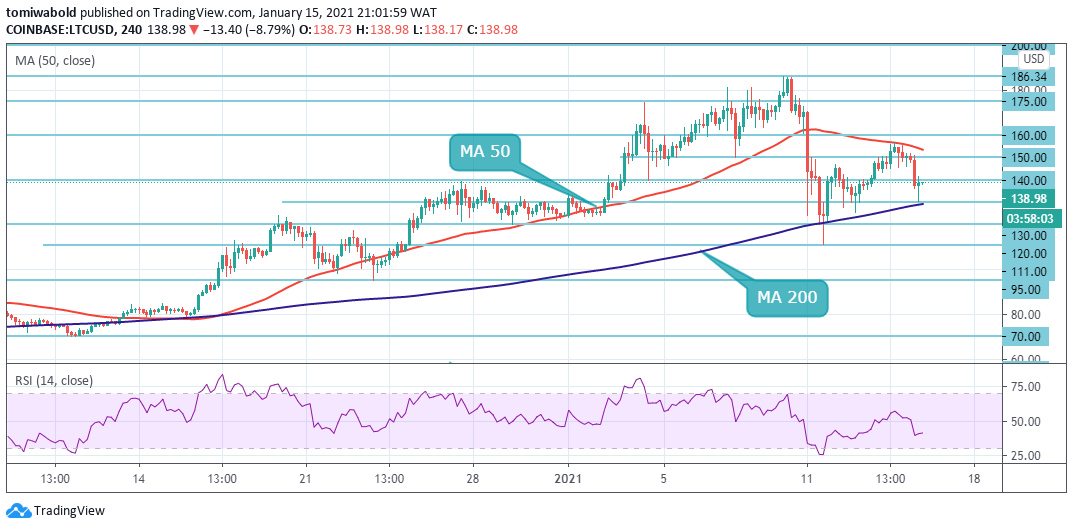 LTC/USD 4-Hour Chart
LTC is initiating a rebound from the $130 low above the MA 200 close. Bulls’ priority in the short term is to reclaim the support turned resistance at the MA 50 coinciding with the $154 mark. A push past this key resistance is crucial to validate the uptrend eyeing $160 and the then previous high of $186.
On the downside, if the bears successfully defend the 4 hour MA 50, the pair may trade between the moving averages for a few days. LTC is presently depending on the MA 200 to hold, if this support located at $130 fails, massive losses to $111 and $95 may come into the picture. The LTC/USD pair is only bullish while trading above the $130 mark, key resistance is found at the $150 and the $175 levels.
Note: Kryptomoney.com is not a financial advisor. Do your research before investing your funds in any financial asset or presented product or event. We are not responsible for your investing results
Image Credit: Shutterstock


Keep in mind that we may receive commissions when you click our links and make purchases. However, this does not impact our reviews and comparisons. We try our best to keep things fair and balanced, in order to help you make the best choice for you.