As the weekend nears, the bullish trend once again resumed across the market as seen in most Cryptocurrencies being in green. The flagship asset, BTC is leading the uptrend holding well above $18,000. LTC hit bottom lows at $41.6 on September 27 and has been climbing steadily since amid a broad-based market recovery. During the week, Litecoin embarked on an uptrend that saw it outperforming its top 10 peers and also reach the highest level since February 2020. As the upside rally on LTC/USD hits 9 months high at $85, Litecoin has gained 12.08% on a day-to-day basis and 31.08% on a 7-day basis. Presently, LTC is trading at $85.19 after setting an intraday high of $85.56. The assets’ free float supply stands at 65,921,435 LTC with an average daily trading volume of $7.1 billion. At a present market capitalization of $5.3 billion, Litecoin unseats BCH to rank 6th largest. Litecoin’s recovery from September lows revved up when payments giant PayPal declared support for cryptocurrency, LTC inclusive.
*Hitting 9-month highs at $85, Litecoin has gained 12.08% on a day-to-day basis and 31.08% on a 7- day basis
*Presently, LTC is trading at $85.19 after setting an intraday high of $85.56
*At a present market capitalization of $5.3 billion, Litecoin unseats BCH to rank 6th largest
Key Levels
Resistance Levels: $100.00, $90.00, $84.50
Support Levels: $80.00, $70.00, $60.00
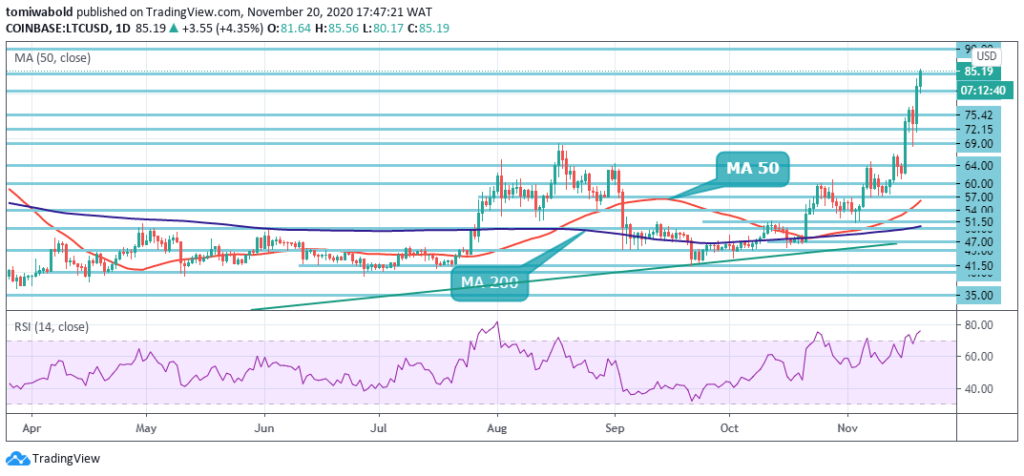 LTC/USD Daily Chart
On the daily chart, the bulls still have an upper hand as LTC managed to flip resistance levels into support in this recent uptrend. The rising moving averages and the RSI in the positive zone reinforce a bullish scenario. Bulls will now attempt to push the price above the $84.50 resistance. If they succeed, the LTC/USD pair could rally to $90 and ultimately $100.
On the downside, LTC bears may have a hard time pushing the price down due to a thick layer of support located down to $69. However, if the bears sink the price beneath this key support at $69, it will suggest that the momentum has weakened. A break below the MA 50 at $56 could signal that the bears have made a strong comeback.
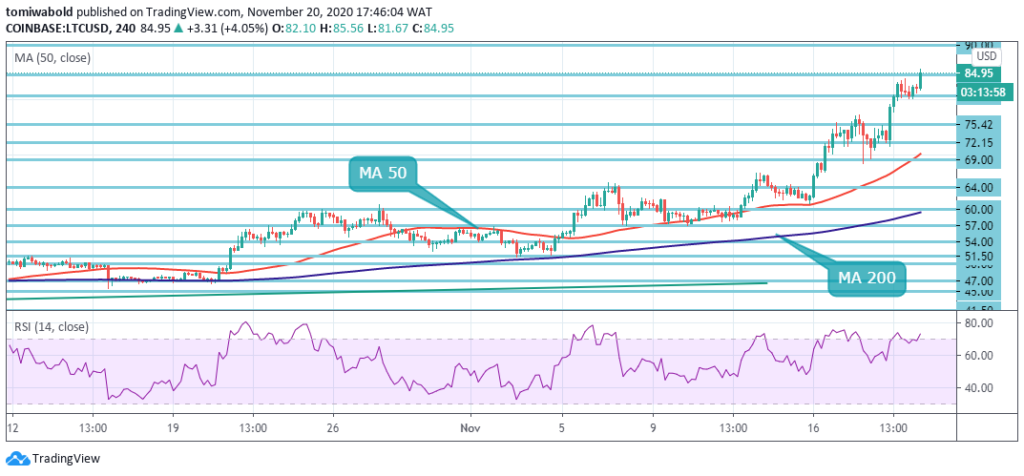 LTC/USD 4-Hour Chart
As seen on the 4- hour chart, LTC bullish momentum took a breather on its approach to $84. A slight correction ensued in which LTC tested the $80 support. The bulls didn’t give up ground as the $80 support absorbed the bearish pressure, preventing Litecoin from falling further. If this support caves in, the sellers will bump into another significant support on the way to $75.
On the upside, a breakout above $84.50 holds the key to an LTC rally to $100. Although while trading beyond the $70 mark and 4 hour MA 50 the LTC/USD pair are only bullish; the main resistance is found at the $84.50 and $90 level. If the LTC/USD pair is trading beneath $70, the $60 and 4 hour MA 200 zone and $50 support levels may be tested by sellers.
Note: Kryptomoney.com is not a financial advisor. Do your research before investing your funds in any financial asset or presented product or event. We are not responsible for your investing results
Image Credit: Shutterstock

Keep in mind that we may receive commissions when you click our links and make purchases. However, this does not impact our reviews and comparisons. We try our best to keep things fair and balanced, in order to help you make the best choice for you.