
Most cryptocurrencies are paring intraday gains as the entire market jolted in response to the Litecoin-Walmart partnership hoax. Litecoin (LTC) rose to highs of $237.88 on Sept. 13, surging nearly 39% following false reports that Walmart planned to have a “Pay with Litecoin Option” for its retail websites starting on Oct. 1 as part of a partnership with the Litecoin Foundation. At the time of post, LTC traded down by 1.35% at $180.25 as bulls made a detour on its price. However, bullish hopes are not lost as LTC fundamentals remain. Litecoin Foundation announced the launch of ‘OmniLite’ on Sept. 7, a protocol that would allow developers to issue tokens such as stablecoins and NFTs atop the LTC network. Also, the Grayscale Litecoin Trust (LTCN) is inching closer to an ETF status, after a recent disclosure by Grayscale revealed that LTCN has become an SEC reporting company. ETF status would open up the trust to the wider retail market greatly increasing the accessibility to investors looking to purchase shares in the trust.
Key Levels
Resistance Levels: $250, $230, $190
Support Levels: $150, $126, $95
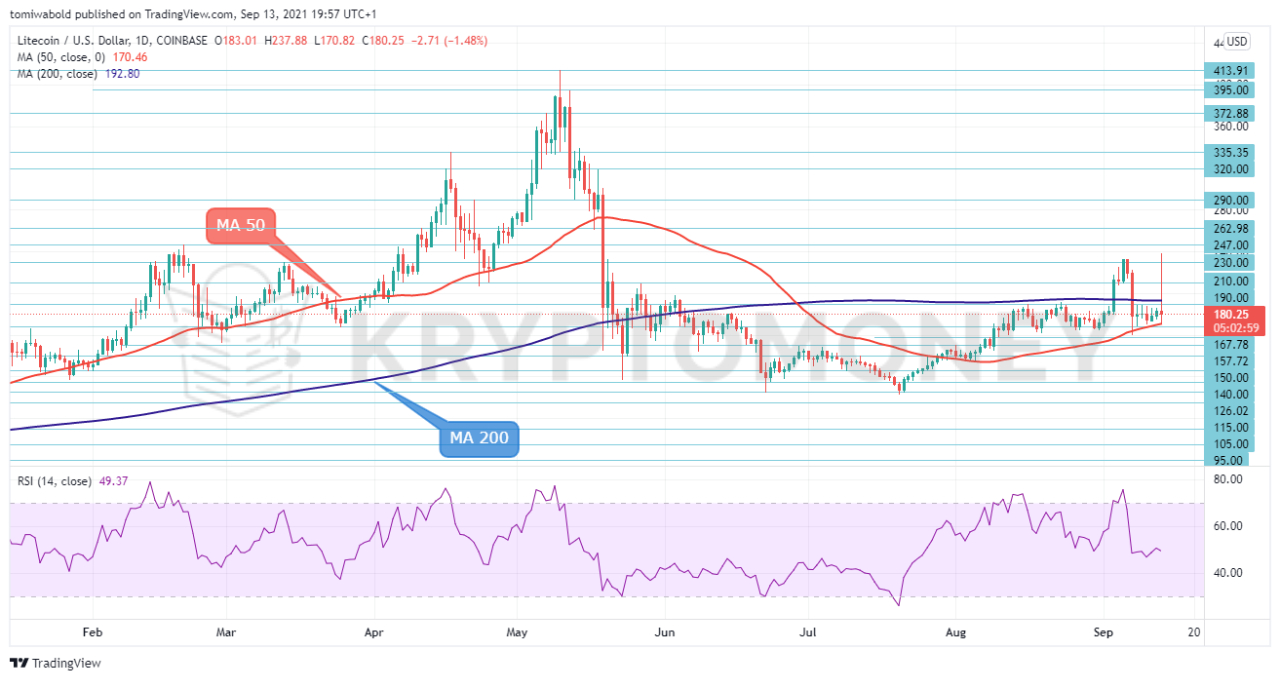 LTC/USD Daily Chart
LTC/USD is down near 2.32% on the day, erasing gains from the previous few sessions.LTC price returns into the previous range after today’s breakout failed to pass above the $240 barrier, earlier confirmed as resistance. Litecoin is likely to find support near the $170 level(MA 50) from which it recovered earlier on. However, if Litecoin’s price breaks down below this level, it opens the risk for further declines.
The next key support area is around the $160 level marking the Sept.7 lows. The RSI hovers slightly beneath the 50 neutral marks, suggesting extended range trading within the MA 50 and 200. On the upside, a cut through the MA 200 ($192) to reattempt a break past the $237 high will set the stage for a move further towards the $278 and the $308 levels.
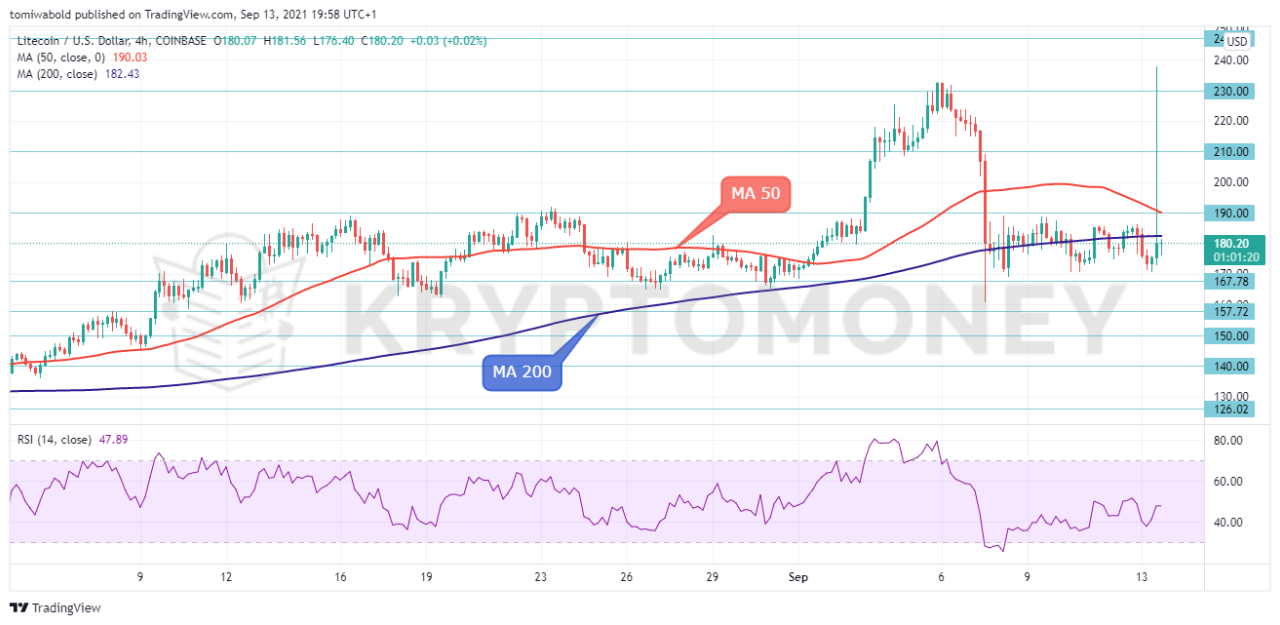 LTCUSD 4-Hour Chart
LTC price saw a huge spike above the 4-hour MA 200 as the price lifted to highs of $237. Having failed its quest to hold above the $237, LTC subsequently returned to trade back within its previous range below the MA 200 ($182). The technical analysis highlights the MA 200 as immediate resistance, upon which a breakout could cause the LTC/USD pair to surge towards the next resistance at the MA 50 ($189).
Beyond here, bulls will aim past the $237 high towards the $300 range. Conversely, a break below the $170 support level could provoke further declines towards the $160 and $136 levels. LTC currently consolidates below key resistance, therefore traders should keep a close eye on the $170-$192 range as a break out of it could define LTC’s next directional move.
Note: Kryptomoney.com is not a financial advisor. Do your research before investing your funds in any financial asset or presented product or event. We are not responsible for your investing results
Image Credit: Shutterstock


Keep in mind that we may receive commissions when you click our links and make purchases. However, this does not impact our reviews and comparisons. We try our best to keep things fair and balanced, in order to help you make the best choice for you.