
The cryptocurrency market is sprouting signs of exhaustion after a massive bull run that brought the market capitalization to the $2T mark again. Polygon (MATIC) had an impressive upswing in recent weeks, rising from lows of $0.62 on July 22 to reach highs of $1.479 on August 12. At the time of writing, MATIC was exchanging hands at $1.31, down 2% on the day as the crypto market bull run takes a breather. The native Polygon bridge has seen considerable improvements over the last couple of months, notably in the reduction of withdrawal times. For instance, Hop recently announced that MATIC withdrawals with the protocol will take 4–5 minutes vs. 7 days, and gas costs will amount to cents as costs are socialized across many Hop users. In July, polygon’s smart contract calls almost equaled that of BSC while outpacing ETH, according to Bitquery data.
Key Levels
Resistance Levels: $2.48, $2.00, $1.50
Support Levels: $1.15, $1.00, $0.62
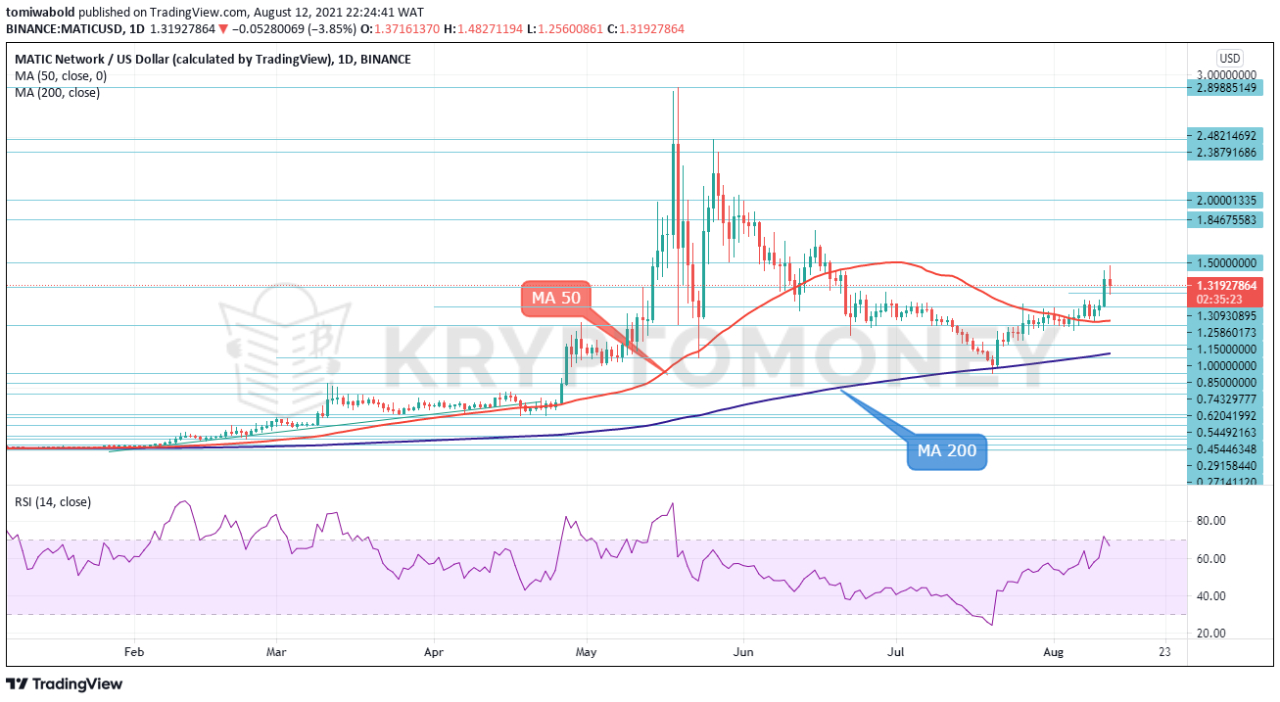 MATIC/USD Daily Chart
MATIC dipped to lows of $1.2560 in today’s trading session, however, it is currently trying to recoup some of the losses. The near-term oscillators are reflecting the slight pullback in the price however appear unconvincing to mature this move. The RSI remains in the bullish territory, slightly moving beneath the 70 levels.
If the market refuses to fall further, immediate resistance could come from $1.50. An aggressive jump above this hurdle could open the way towards the $1.758 ahead of the $2.0 level. Above that, the $2.48 level could impede bullish actions towards all-time highs of $2.89. However, more downside pressures could see MATIC retest the $1.15- $1.00 (MA 50) zone before tumbling to the MA 200 support at $0.775.
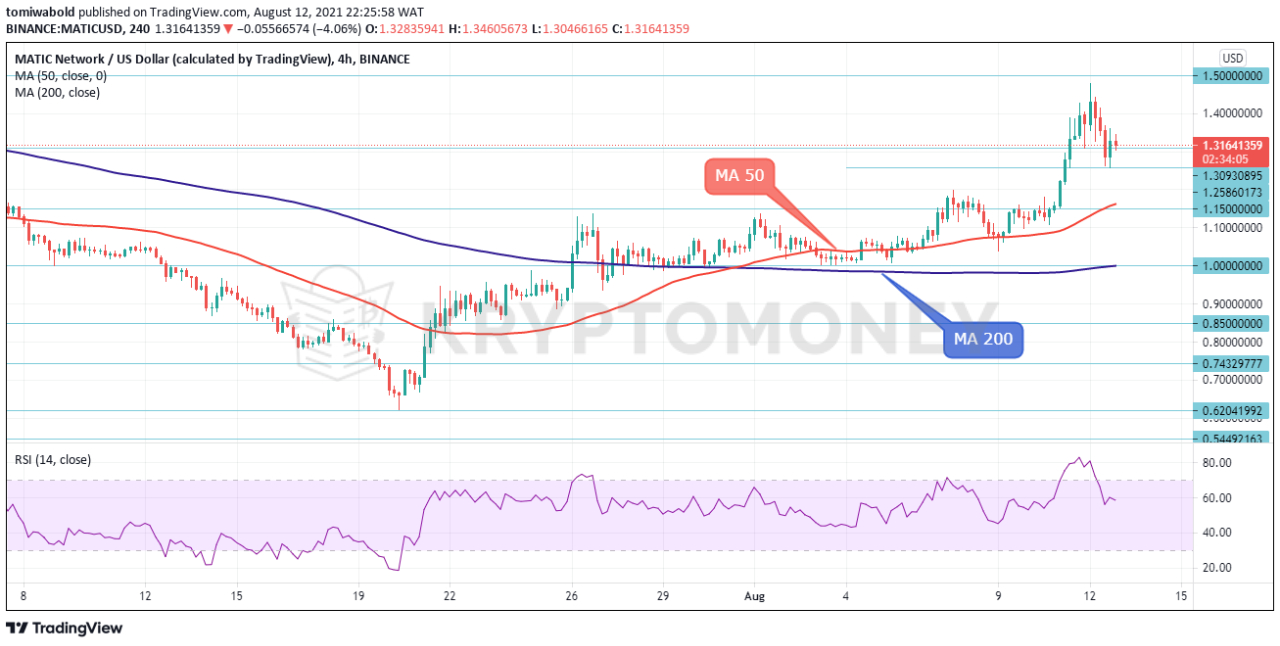 MATIC/USD 4-Hour Chart
MATIC is returning slightly higher after the selling interest from highs of $1.47 achieved on August 12. The price is yet to gather much momentum to the downside with the RSI hovering in the bullish levels around 60. If the price recoups the losses and jumps above the $1.47 high, it could open the way for the $2 psychological level. A successful break above this obstacle could touch the $2.48 ahead of $2.89 May all-time highs.
Otherwise, if selling interest increases, initial downside constraints could come from the $1.258 low. Diving from here, the bears could encounter the moving averages 50 and 200 at $1.16 and $0.99 levels respectively, before aiming for the $0.85 and $0.62 support levels. To summarize, MATIC/USD is under negative strain however no clear-cut bearish signals are cementing a deteriorating bias, as long as the pair holds above the $1.05 barrier (Daily MA 50).
Note: Kryptomoney.com is not a financial advisor. Do your research before investing your funds in any financial asset or presented product or event. We are not responsible for your investing results
Image Credit: Shutterstock


Keep in mind that we may receive commissions when you click our links and make purchases. However, this does not impact our reviews and comparisons. We try our best to keep things fair and balanced, in order to help you make the best choice for you.
