
The cryptocurrency market is experiencing a dip amid near-term profit-taking. The majority of tokens including Polygon (MATIC) were seen trading in the red as investors pulled gains. At the time of writing, MATIC was exchanging hands at $1.479, down 9% on the day. Ranking 17th largest, Polygon’s market valuation stands at $9.91 billion with a 24-hour trading volume of $859 million. The ”Magician”, Leo Messi’s NFT drop powered by Polygon goes live on Ethernity chain, a digital platform that produces licensed and authenticated NFTs. Polygon is seeing developmental growth as it recently announced a collaboration with Filecoin. Data from any Polygon address owner would be stored by the Open file folder, textile’s Filecoin-Polygon Storage, thus accelerating the Web3 interoperability between Polygon & Filecoin ecosystems.
Key Levels
Resistance Levels: $2.43, $2.00, $1.70
Support Levels: $1.27, $1.00, $0.62
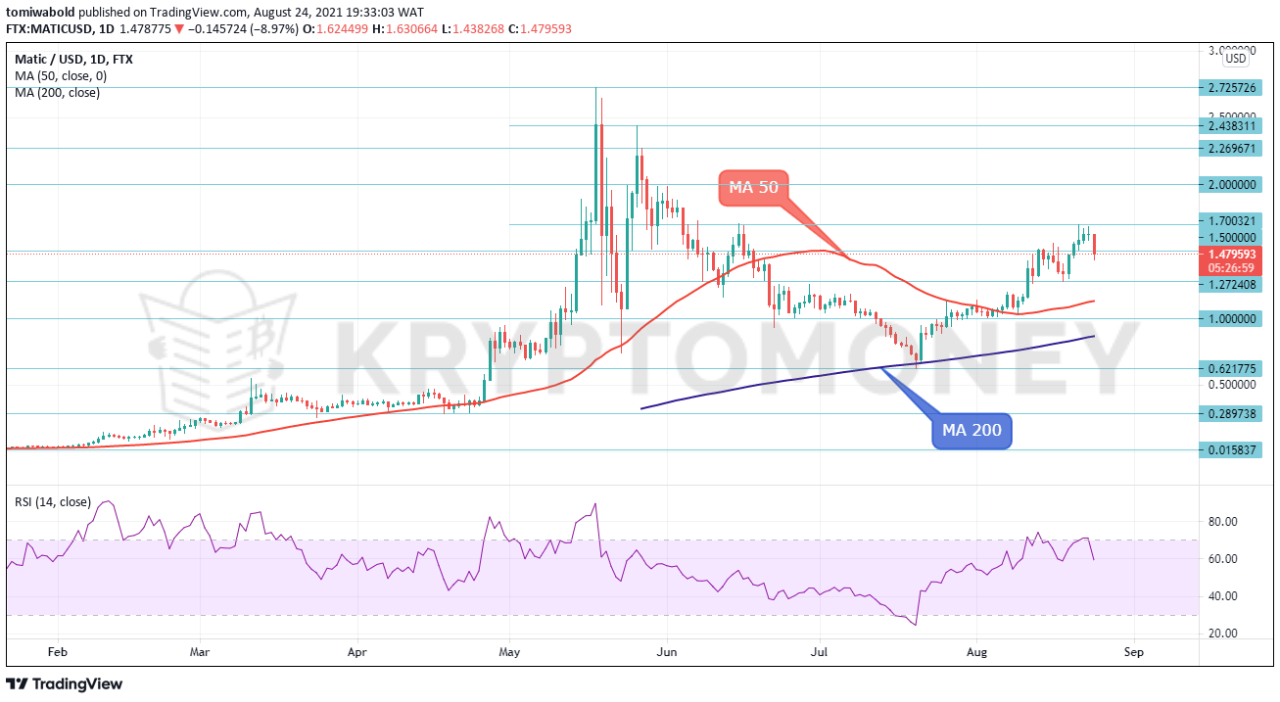 MATIC/USD Daily Chart
In the past few weeks, MATIC/USD gained momentum above the $0.62 July 20 floor to reach highs last seen since Mid June. Recently, MATIC posted five consecutive days in the green to reach $1.70 highs on Aug. 23. However, MATIC suffered a near-term correction on Aug 24. as Traders took profit from the five-day rally, pushing lower to $1.432.
Current easing could be seen as positioning for fresh upside, with extended dips expected to find ground near $1.41 and $1.27 levels ahead of the MA 50 ($1.12) barrier now reverted to support to keep bulls in play. Pullback so far looks like corrective action as the RSI hovers around the 60 marks. Fresh upside action requires a sustained break above the $1.70 resistance confirmed since Mid June to generate a bullish signal for a recovery towards $1.98, $2.43, and then the $2.82 all-time highs.
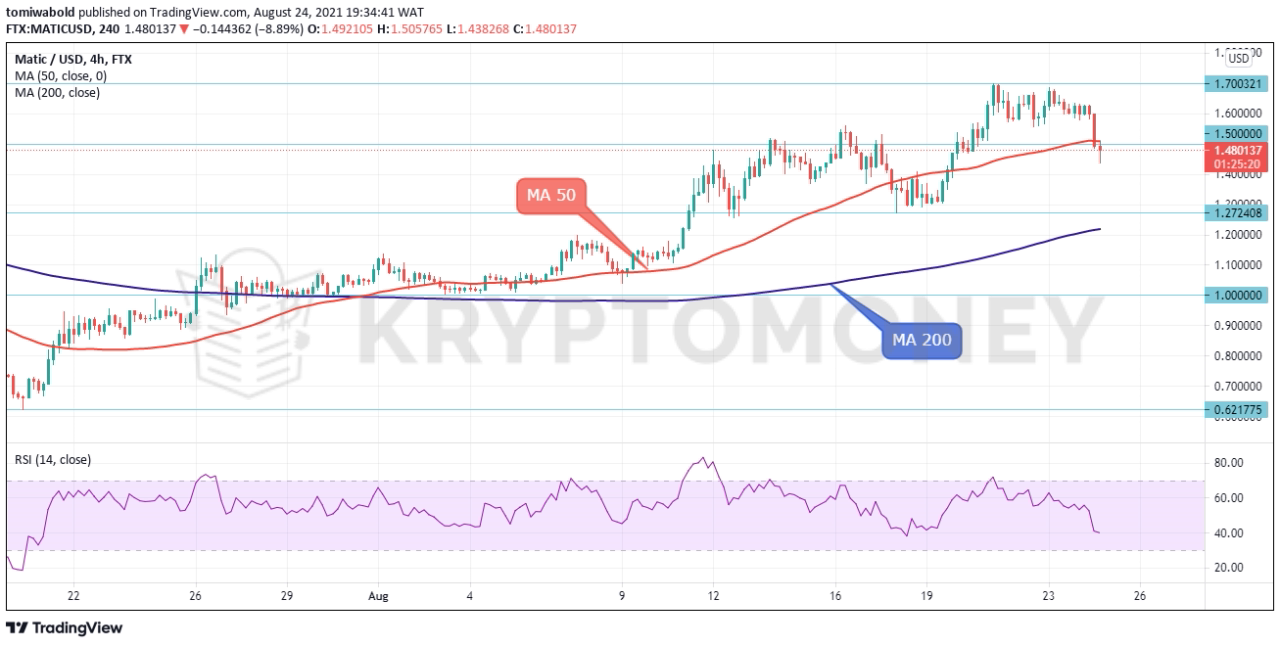 MATIC/USD 4-Hour Chart
As seen on the 4-hour chart, MATIC retreated from recent highs amid profit-taking. However, the bears have so far been unable to push the price below the $1.43 mark as bulls rose to the rescue. In case of further declines, the first line of support may be found at $1.273 and the MA 200, currently at $1.21. A decisive break below that area would turn the picture to a negative one, and open the door for a test of the $1 psychological handle.
On the flip side, a rebound in the market may encounter immediate resistance near the MA 50 support now turned barrier at $1.50, with an upside break paving the way for a retest of the $1.70 high ahead of the $2 range. Overall, the technical oscillators are transmitting mixed directional momentum, howbeit as long as this latest decline remains limited above the $1.436 low, it might be treated as a corrective phase.
Note: Kryptomoney.com is not a financial advisor. Do your research before investing your funds in any financial asset or presented product or event. We are not responsible for your investing results
Image Credit: Shutterstock


Keep in mind that we may receive commissions when you click our links and make purchases. However, this does not impact our reviews and comparisons. We try our best to keep things fair and balanced, in order to help you make the best choice for you.
