
The cryptocurrency market trading remains mixed as Bitcoin tackles the key $40k resistance. While the majority of digital assets remain well below established highs before last week’s major declines, MATIC’s price had recovered swiftly from its May 23 lows of $0.74. Matic climbed higher until May 26 following the news of billionaire Mark Cuban’s undisclosed investment in Ethereum Layer 2 polygon and also the launch of the SDK stack. At the time of writing, MATIC was trading at $2.03, down by 2.49% on the day. With a present market cap of $13.31 billion, MATIC has flipped Litecoin to rank 14th largest. Billionaire Mark Cuban admitted that he was a polygon user while also stating that he plans to integrate it into Lazy.com, a Cuban portfolio company that allows people to easily display non-fungible tokens (NFTs).
Key Levels
Resistance Levels: $4.0, $3.50, $3.0
Support Levels: $1.50, $1.00, $0.67
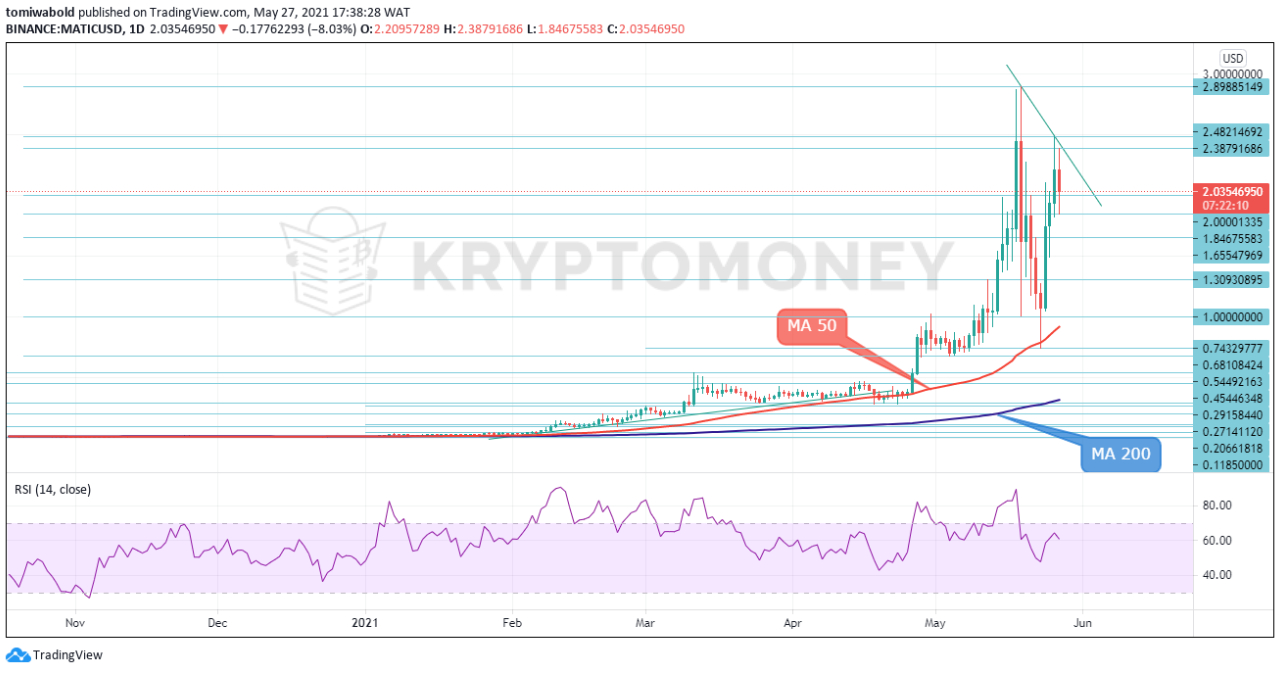 MATIC/USD Daily Chart
MATIC gapped lower to lows of $1.84 during Thursday trading as short-term traders pulled profits. On a daily timeframe, it looks as if MATIC /USD could be forming bullish cup-and-handle formation. After the pair broke higher in mid-May, it spiked higher to an all-time high of $2.89 on May 19. The MATIC/USD pair then pulled back to lows of $0.74 and began a rounding bottom formation (the cup) back towards the highs. MATIC appears to be currently putting in the “handle” portion of the cup-and-handle formation in today’s retracement.
Because the handle in this pattern formation usually has a downward slope, in the event of the immediate support at $1.86 giving way, a downside break towards $1.50 and $1.01 may come into focus. The strong MA 50 support at $0.92 could put a lid to further losses. However a close above today’s high of $2.48 could target $2.89 and then new all-time highs at $3 and $4. The RSI remains in positive territory suggesting an advantage to the bulls.
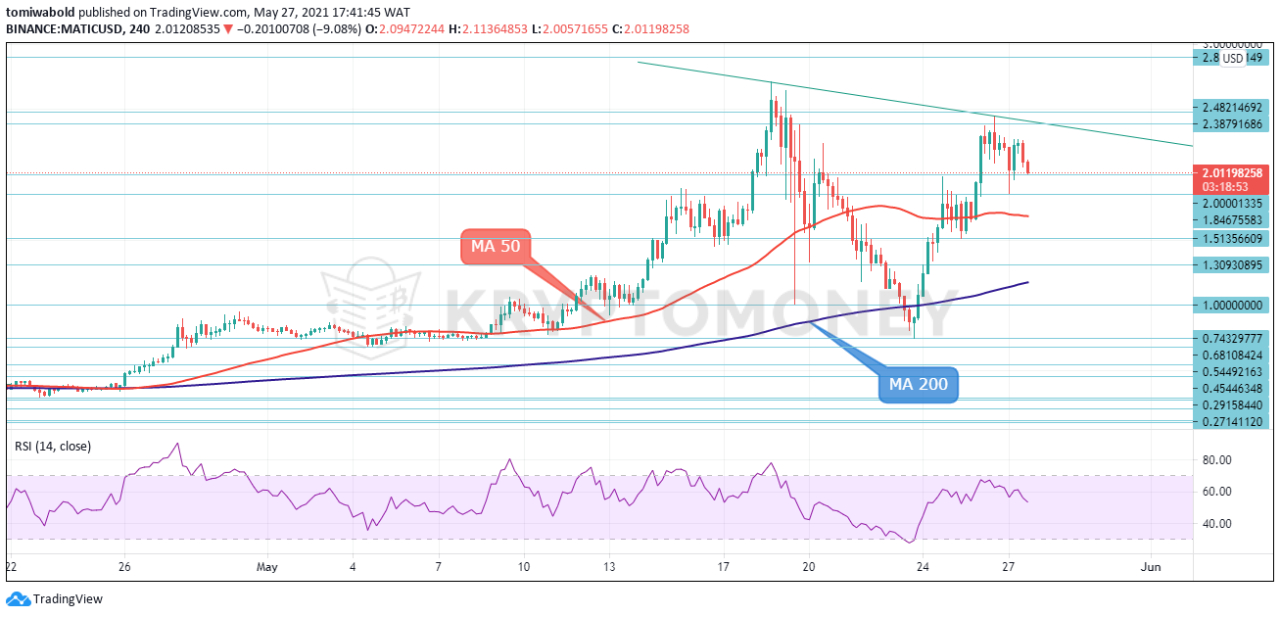 MATIC/USD 4-Hour Chart
The MATIC/USD has formed a cup with a handle pattern on the 4-hour chart and further continuation to the upside may be expected. The ‘Cup and Handle pattern is a bullish continuation pattern that begins with a consolidation period, followed by a breakout. The consolidation period is captured within the handle. The RSI slightly above the mid 50 reading is suggesting possible consolidation.
Technically, the MATIC/USD pair could bounce from the psychological $2 level towards the handle top around $2.45. A close above the $2.45 should move the price towards the all-time highs of $2.89 and ultimately the $3 range. Further bullish moves could target the $5 level. On the downside, MATIC is supported by the $1.86, the MA 50 at $1.68, and the MA 200 at $1.16. Ideally, the MATIC/USD pair should remain above the MA 50 to remain bullish.
Note: Kryptomoney.com is not a financial advisor. Do your research before investing your funds in any financial asset or presented product or event. We are not responsible for your investing results
Image Credit: Shutterstock


Keep in mind that we may receive commissions when you click our links and make purchases. However, this does not impact our reviews and comparisons. We try our best to keep things fair and balanced, in order to help you make the best choice for you.