
Prices of cryptocurrencies including that of Polygon (MATIC) continued the slump on September 21 amid a broad market selloff, led by fears about the Evergrande crisis brewing in China. MATIC dropped to mark lows at $1.09 on Sept. 20 following a shaky start to the week. Presently, MATIC is trading down by 7% on the day at $1.05. Bitfinex, one of the most liquid and oldest exchanges enables trading for MATIC pairs starting from Sept. 21. This same day, Gary Gensler talks crypto at the Washington post live on the path forward. The market reaction to the SEC’s chair speech is yet uncertain, with most crypto assets sustaining losses from the slump during the day. Polygon, a protocol and a framework for building and connecting Ethereum-compatible blockchain networks ticks optimism based on fundamentals as a scroll through its Twitter feeds indicates new user onboardings, integrations, and certifications.
Key Levels
Resistance Levels: $1.50, $1.30, $1.25
Support Levels: $1.00, $0.85, $0.62
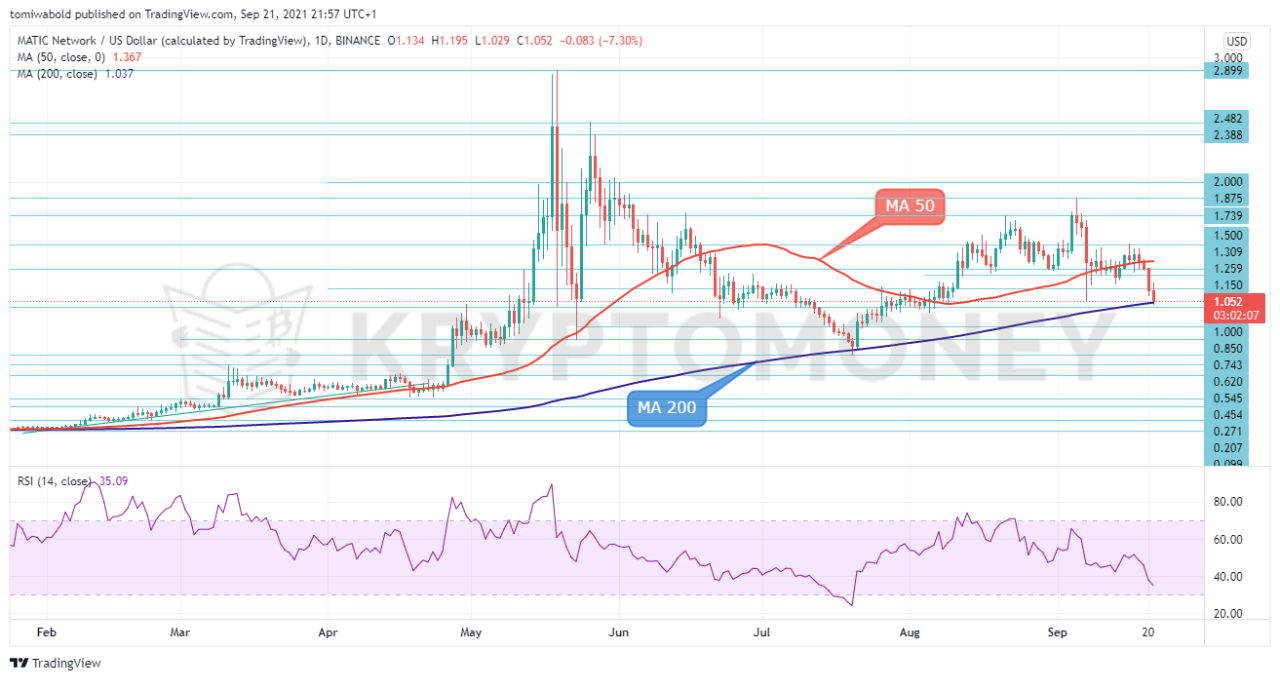 MATIC/USD Daily Chart
The MATIC/USD pair remained in consolidation after meeting strong selling pressure at the $1.87 barrier on Sept. 5. Polygon (MATIC) is presently pushing for a rebound after its 4-day decline broke beneath the MA 50 ($1.36) to touch down at the MA 200 ($1.03) on Sept. 21. However, the pair can capitalize on strong buying interest from the MA 200 seen from the July 21 rebound.
That said, A sustained rebound above the MA 200 would put MATIC back on track and extend the rally back towards the MA 50 at $1.36. Strong buying interest may lift bids to Sept. 5 high at $1.87. A breach of that ceiling would attract momentum buying and snap MATIC out of its month-long consolidation streak. Alternatively, a close below said support would deepen the correction to $0.96 ahead of the $0.66 support at the origin of the late July rebound.
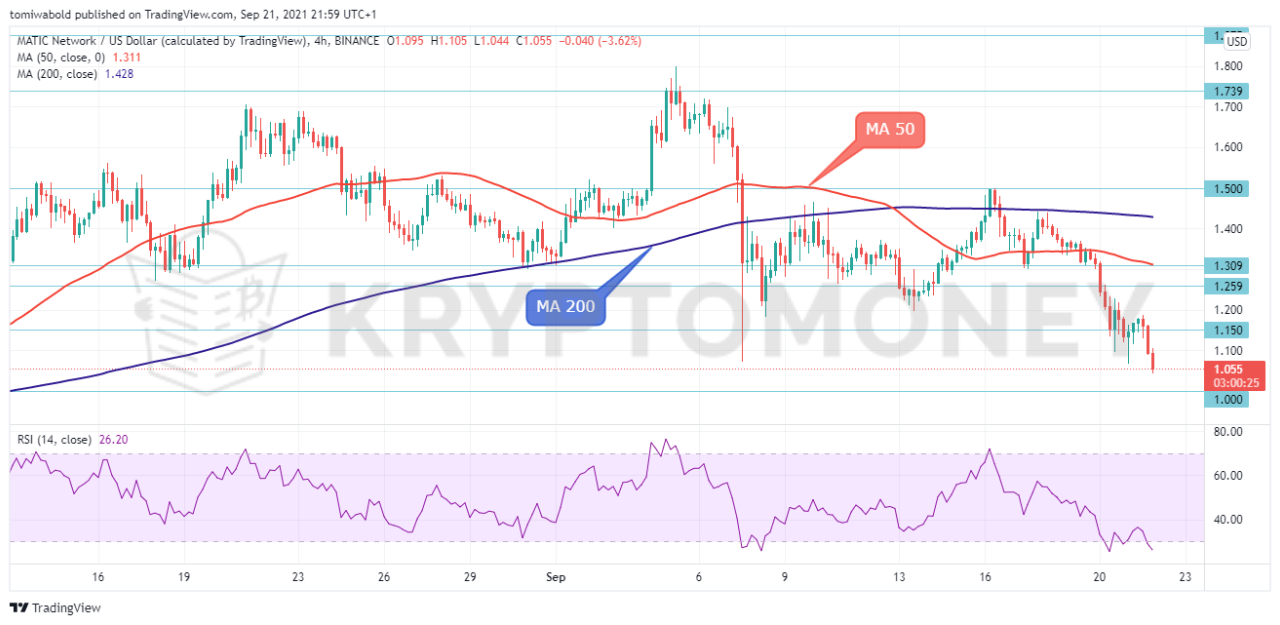 MATIC/USD 4-Hour Chart
The MATIC/USD pair started a downward move from the $1.48 high on Sept. 15 and broke beneath the MA 50 and 200 at $1.31 and $1.43 respectively. The $1.07 support from which MATIC rebounded during the Sept. 7 ” flash crash” remains a key area to hold to prevent further declines. A double-bottom pattern may form if sellers fail to breach the $1.07 support level, raising hopes of a positive reversal.
The RSI in the oversold territory also increases the chances of a possible relief rally for incoming sessions. Traders, however, should be cautious and watch for the general recovery of the markets before placing orders. Alternatively, if the $1.07 fails to cushion the declines, the next pivot point could occur near the $1 round level. In brief, MATIC may set the stage for a positive reversal if this present decline doesn’t pass the $1.03 low.
Note: Kryptomoney.com is not a financial advisor. Do your research before investing your funds in any financial asset or presented product or event. We are not responsible for your investing results
Image Credit: Shutterstock


Keep in mind that we may receive commissions when you click our links and make purchases. However, this does not impact our reviews and comparisons. We try our best to keep things fair and balanced, in order to help you make the best choice for you.
