
The cryptocurrency market is trading in a mixed manner for now. IOTA (MIOTA) is up 7% despite the flat price action seen across the markets. Currently trading at $1.359, IOTA is expected to see further gains pushing the price towards the $1.49-$1.70 level where resistance has been established. Regarding fundamentals, the smart contracts beta release and a recent LATOKEN listing will be light for the IOTA/USD pair. On Oct. 21, The Iota Foundation announced the release of its beta version smart contract functionality intending to solve market challenges of scalability limitations and high transaction fees- Specifically, IOTA Smart Contracts enables the feeless transfer of assets across chains. In March, the IOTA Network had announced the release of its alpha Iota Smart Contracts Protocol.
Key Levels
Resistance Levels: $1.6000, $1.5004, $1.4000
Support Levels: $1.2737, $1.8000, $1.1000
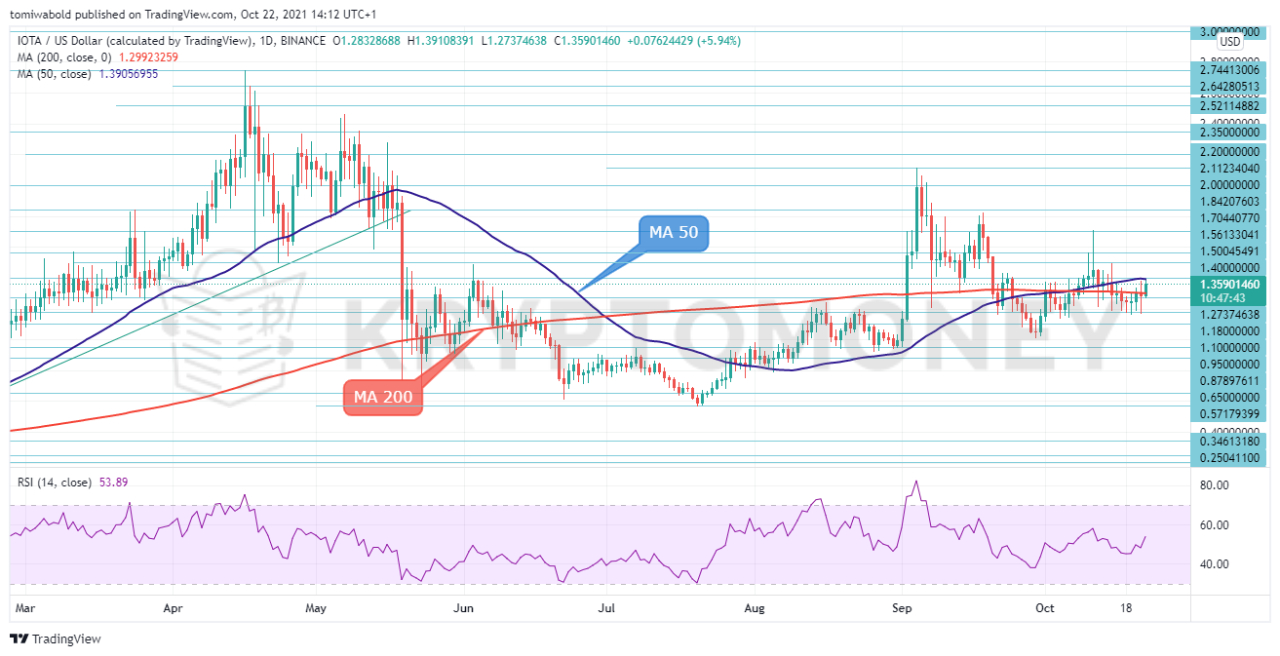 IOTA/USD Daily Chart
IOTA extended its recovery from Oct. 19 lows of $1.16 and the MA 200 ($1.39) until another obstacle emerged. The MA 50 at $1.39 appears to be offering resistance for the IOTA/USD pair on Friday. Should it break above here, it could be a bullish signal with potential targets reaching the $1.70 or even the $2 mark. The upside reversal in the momentum indicators is endorsing the above positive scenario, as the RSI is hovering above its 50 neutral levels.
The positive crossing of the moving averages and an emerging cup with a handle pattern seems to lend credence to the bulls. The Cup and Handle pattern is a bullish continuation pattern that begins with a consolidation period, followed by a breakout. Alternatively, failure to bounce above the MA 50 barrier could see another test near the MA 200 at $1.39 ahead of the $1 psychological mark.
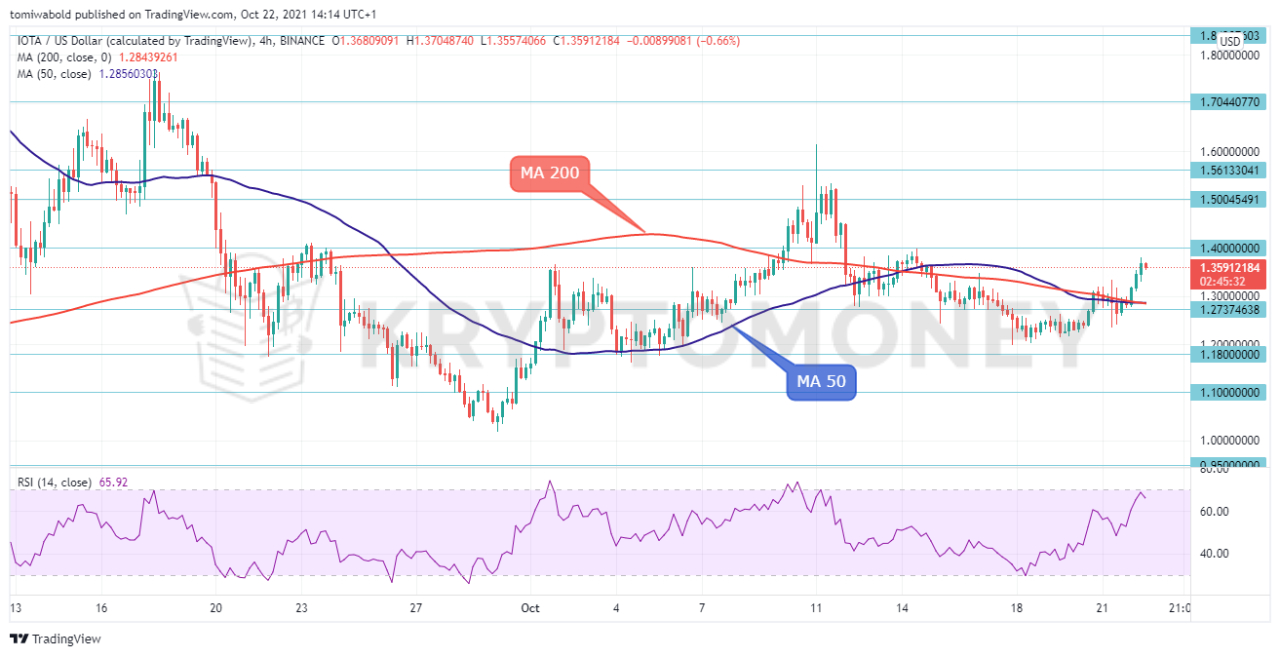 IOTA/USD 4-Hour Chart
IOTA had a recovery from lows of $1.23 this week, crossing its moving averages (MA) in the 4-hour chart to peak near the October 14 restrictive line at $1.397. A break above $1.40 is needed to signal an end of the present consolidative phase and continuation of the rally from $1.23 (Oct. 21 low) towards the barrier at $1.61. Overthrowing this, buyers may gear up for the $2 mark ahead of the $2.74 yearly high.
Alternatively, a downside break would open the way for the $1.28 level, where the convergence of the MA 50 and 200 is roughly located. Summarizing, despite IOTA’s latest rebound, the big picture remains neutral although slightly bullish. Traders are waiting for a close above the $1.40 mark to increase exposure in the market.
Note: Kryptomoney.com is not a financial advisor. Do your research before investing your funds in any financial asset or presented product or event. We are not responsible for your investing results
Image Credit: Shutterstock


Keep in mind that we may receive commissions when you click our links and make purchases. However, this does not impact our reviews and comparisons. We try our best to keep things fair and balanced, in order to help you make the best choice for you.