
The first and largest cryptocurrency by market capitalization, Bitcoin (BTC) has continued to see a staircase-like rally over the last six months, which has allowed it to evolve into a prolonged uptrend.
On November 13th, Bitcoin set new yearly highs of $16,491 but faced rejection at this price level. Data indicated there was a stack of sell orders above $16,500 which did not subside when BTC price reached $16,400. This seemed to suggest that the sell orders at this level are not spoofed orders indicating that sellers are genuinely attempting to take profit on BTC at around $16,500.
In 2017, Bitcoin had a historic price rally, setting all-time highs of $20,089 in the process. Several analysts think that Bitcoin’s present market structure is different from the previous cycle citing that when BTC hit $16,000 in 2017, the market was extremely overheated with extreme volatility but this time around the rally appears to have volume behind it.
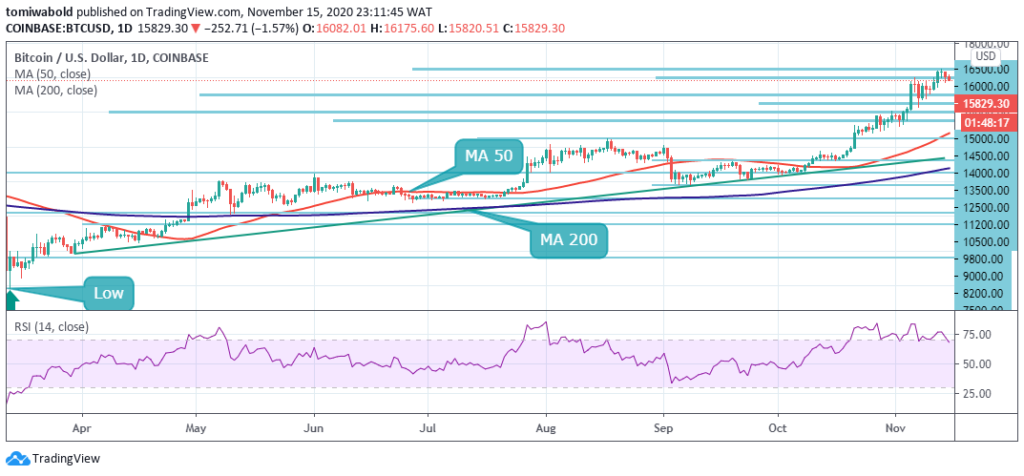 BTC/USD Daily Chart
However, on-chain data indicated a new trend among large Bitcoin (BTC) investors when it crossed $16,000. Bitcoin (BTC) is presently trading at $15,829.
A group of analysts from Whalemap described the recent surge in demand for Bitcoin from Whales as “institutional FOMO.” FOMO, the acronym for “fear of missing out,” refers to a trend wherein investors increasingly buy into an asset fearing it will continuously surge.
Whale clusters appear when whale addresses referring to holders of over 10,000 BTC buy Bitcoin and do not move it for prolonged periods. This may suggest that these large volume holders plan to hold their most recent BTC purchases in their wallets. Whalemap analysts stated:
“Bubbles indicate prices at which whales have purchased BTC that they are currently holding.”
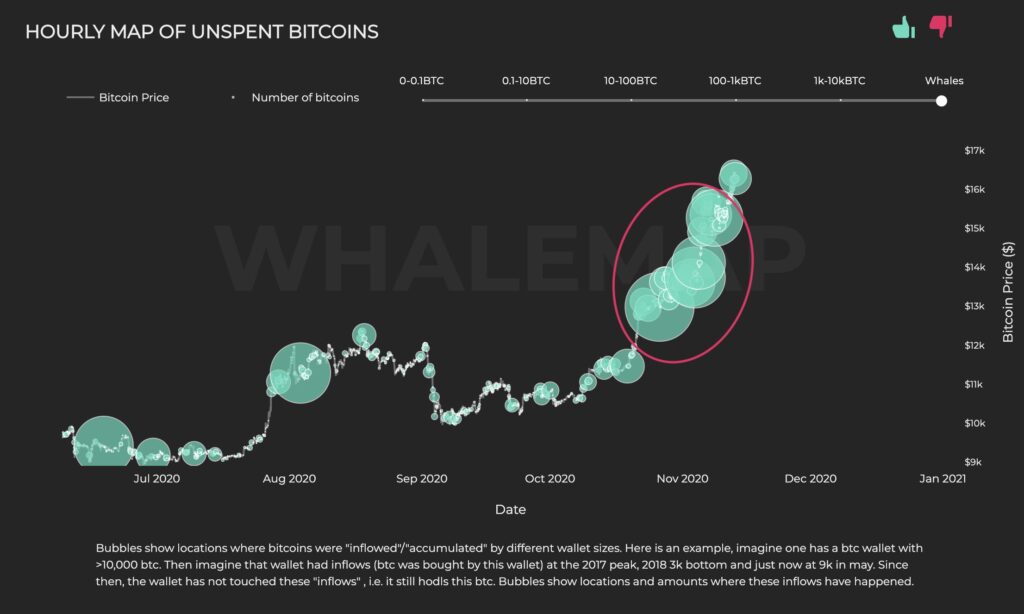 Bitcoin whale clusters throughout 2020. Courtesy: Whalemap
However, when Bitcoin crossed $16,000, a new trend emerged among the whales as various on-chain data started pointing at a whale-induced BTC sell-off. Many reasons make $16,000 an eye-catching area for sellers, first, $16k is a heavy resistance level, Bitcoin suffered rejection at this level on at least two counts in 2017. Second, there is significant liquidity at $16,000 owing to resistance. Stablecoin inflows also indicate $16k has seen relatively high buyer demand, hence, the tussle between bulls and bears at $16K makes it an area with high liquidity, which is compelling for sellers.
A pseudonymous trader CL noted that on Nov. 15, a Bitcoin (BTC) whale placed a $100 million short on Bybit. Also, there are Increasing signs of whales taking profits as order flows show that there were sell orders worth around $3.5 million on average consecutively over several hours.
Whales profit taking is also seen as exchanges like U.S. based Gemini have seen large deposits over the last 24 hours. CryptoQuant puts inflow into the Gemini exchange at 9,000 BTC noting that exchanges such as Coinbase and Gemini are preferred by Whales due to their strict compliance and strong regulatory measures.
On the massive BTC inflow into Gemini, which is worth $143 million, a pseudonymous researcher “Blackbeard” said it is time to be cautious.
Image Credit: Whalemap, Shutterstock


Keep in mind that we may receive commissions when you click our links and make purchases. However, this does not impact our reviews and comparisons. We try our best to keep things fair and balanced, in order to help you make the best choice for you.
