
Ripple price appears in a downward range and if the XRPUSD pair manages to break above the $0.27 resistance level, the market could rally towards the $0.29, $0.31 and $0.33 resistance levels.
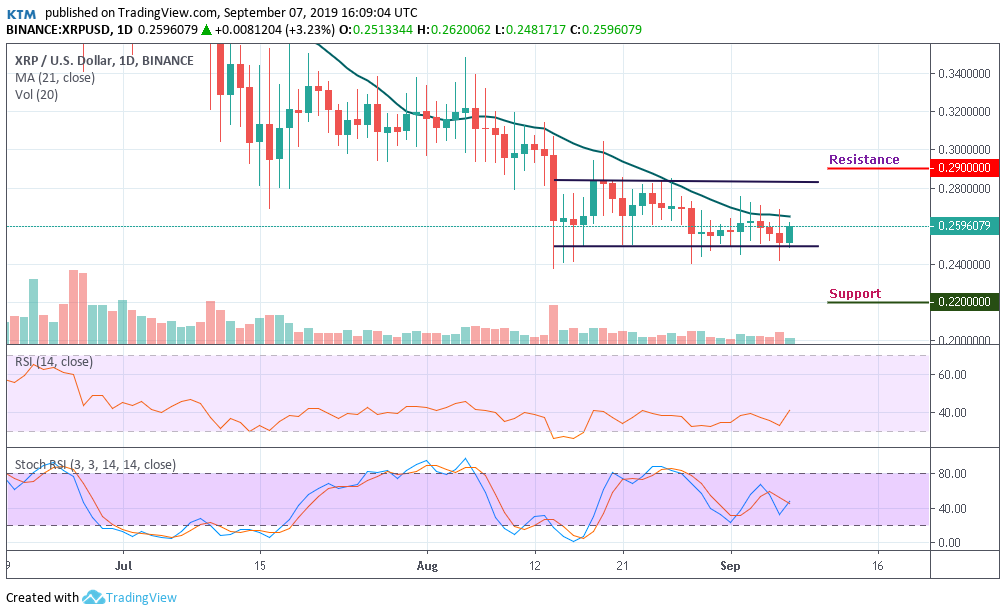
XRPUSD Price Chart
Yesterday, September 6, the price of Ripple (XRP) price was in a range-bound movement below the 12 and 26-day Exponential Moving Averages (EMAs). The crypto’s price has been consolidating at the $0.26 level as there is no significant momentum in the market as both the Bears and the Bulls have lost momentum.
On the upside, if more buyers emerge, the coin will face resistance at the $0.29, $0.31 and $0.33 price levels. On the downside, if the bears gain control of the market, the crypto’ price will decline to the support levels of $0.22, $0.20 and $0.18. In the meantime, the Moving Average Convergence Divergence (MACD) line and the signal line are below the zero line which indicates a sell signal.
On the 1-hour chart, XRPUSD price is in a bearish trend. Since June 27, every pullback has turned down from the 12 and 26-day EMAs. Today, the price of XRPUSD has continued to range as the price remains at $0.26 price level. If the bears prevail over the bulls, the market will drop to a low of $0.22 price level. In the meantime, the MACD line and the signal line are above the zero line which indicates a buy signal.
Arathur Stephen is not registered as an investment adviser with any federal or state regulatory agency. The information above should not be construed as investment or trading advice and is not meant to be a solicitation or recommendation to buy, sell, or hold any cryptocurrencies. The information is solely provided for informational and educational purposes. Always seek the advice of a duly licensed professional before you make any investment.


Keep in mind that we may receive commissions when you click our links and make purchases. However, this does not impact our reviews and comparisons. We try our best to keep things fair and balanced, in order to help you make the best choice for you.


