
In this Ripple price prediction, the XRPUSD pair is consolidating above the $0.35 price level and trades above the EMAs. If XRP price is sustained, the bulls will break the $0.37 and $0.38 resistance levels.
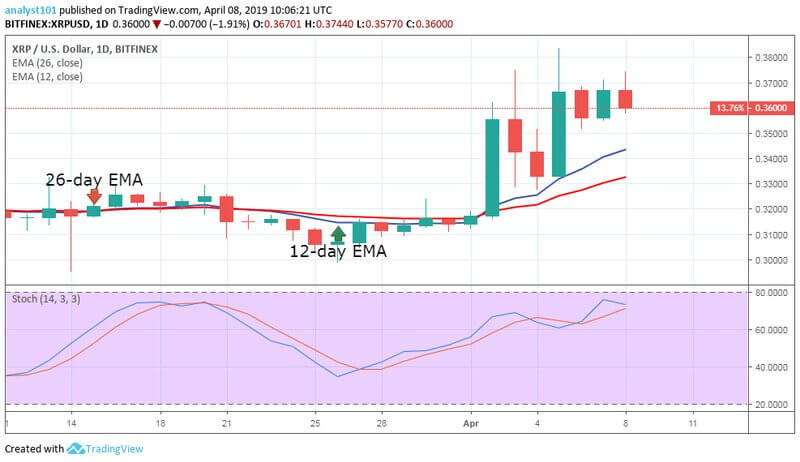
Ripple (XRP) price was in a bullish trend last week. XRP bulls broke the price level of $0.34 and reached a high of $0.37469, however, the price made a downward correction to the support of the 12-day Exponential Moving Averages (EMA).
On April 5, XRP bulls resumed the bullish trend at the support of the 12-day EMA. While the price climbed to a high of $0.38353, it was, however, resisted by the bears at the $0.36635 price level. Today, April 8, the price of Ripple is trading above the $0.35 level while above the 12-day EMA as well as the 26-day EMA to indicate that price is in the bullish trend zone.
If the bullish trend is sustained above the EMAs, the price will break the resistance levels of $0.37 and $0.38. Thus, the price can be expected to trade above the $0.40 price level. However, if the bulls fail to break the resistance level, Ripple price will decline. In the meantime, the Stochastic indicator is in the overbought region while above the 60% range, indicating that the crypto’s price is in the bullish trend zone and a buy signal.
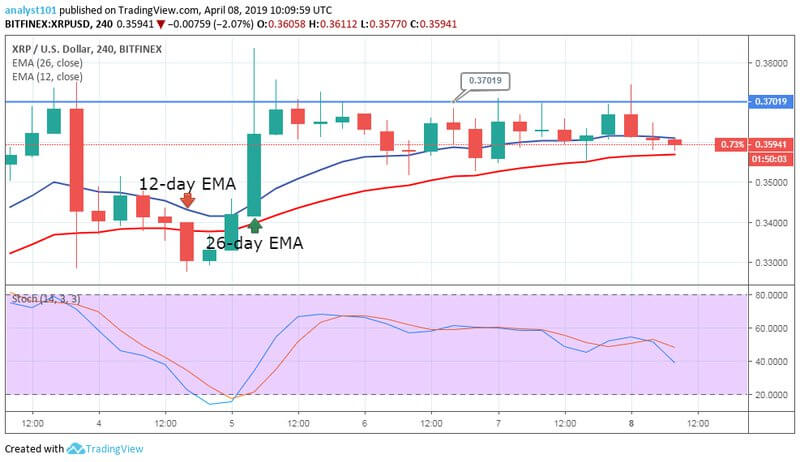
As seen in the 4-hour chart, XRPUSD price is in a sideways trend zone. Last week Wednesday, XRP bulls tested the $0.37 price level but were, however, resisted. They tested the $0.37 price level for the fifth time but the price could not be sustained on each occasion, falling to the support of the EMAs.
At the moment, XRPUSD price is retracing after testing the $0.37 price level. If price breaks the $0.37 price level, the price of Ripple will likely meet another resistance at the $0.38 price level. In the meantime, the Stochastic indicator is out of the overbought level region while below the 60% range, an indication that the XRP price is in a bearish trend zone and a sell signal.
Arathur Stephen is not registered as an investment adviser with any federal or state regulatory agency. The Information above should not be construed as investment or trading advice and is not meant to be a solicitation or recommendation to buy, sell, or hold any cryptocurrencies. The information is solely provided for informational and educational purposes. Always seek the advice of a duly licensed professional before you make any investment.


Keep in mind that we may receive commissions when you click our links and make purchases. However, this does not impact our reviews and comparisons. We try our best to keep things fair and balanced, in order to help you make the best choice for you.
