
Ripple (XRP) price has remained in the bearish trend and it has declined to $0.30 level. Yesterday, it was expected if the price drops to $0.30, XRP price could find support. Nevertheless, the bears broke the aforementioned level and continued the downward trend.
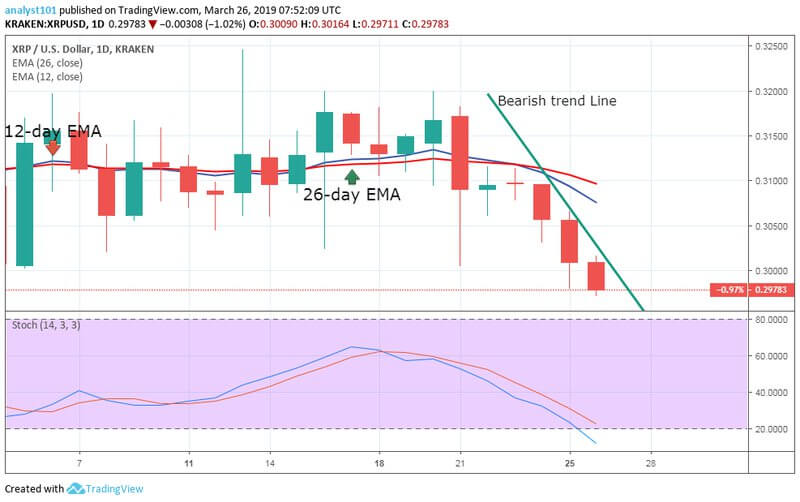
The bears have remained in action and have dragged the price down to a range between $0.28 and $0.34. Today, at the time of writing, Ripple price is trading at $0.29 and the bearish trend is yet to be broken. As the chart shows, the Stochastic indicator is in the oversold region at range 20, which is an indication of a bearish momentum and a sell signal.
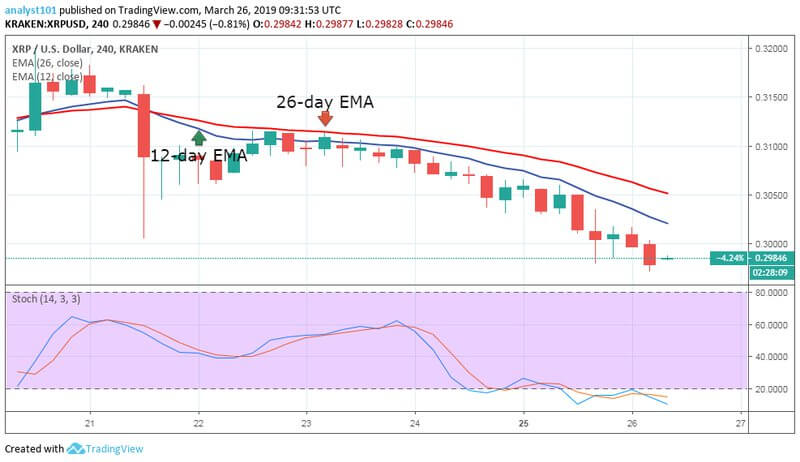
Meanwhile, the 4-hour chart shows that XRP is in a bearish trend. Looking back to March 21, XRP bears broke the 12-day Exponential Moving Average (EMA) as well as the 26-day EMA as Ripple price kept on falling. Moreover, Stochastic indicator is also in the oversold region just below 20, an indication that Ripple’s strong downtrend, and also a sell signal.


Keep in mind that we may receive commissions when you click our links and make purchases. However, this does not impact our reviews and comparisons. We try our best to keep things fair and balanced, in order to help you make the best choice for you.