
According to technical analysis provided by Bitrue exchange, Shiba Inu may be forming a tight bull pennant for possible breakout followed by parabolic upside moves. ‘’Nearest target will be $0.00002050, although with parabolic moves price could breach any resistances as long as buying momentum persist’’. A bull pennant is a continuation pattern marked by a period of consolidation or slight dip before the next upside move. At the time of publication, Shiba Inu was trading down 7% at $0.000015, however, remains 15% weekly. William Volk stated that due to a higher-than-expected number of players, the team had to increase the capacity of gameplay servers 50-fold indicates that the Shiba Eternity game is already seeing great popularity in Vietnam. BitWallet Inc., a U.S Department of Treasury’s Money Services Business, announced via tweet that it would soon list four altcoins, including Shiba Inu (SHIB).
Key Levels
Resistance Levels: $0.00002185, $0.00002050, $0.00001800
Support Levels: $0.00001300, $0.00001209, $0.00001000
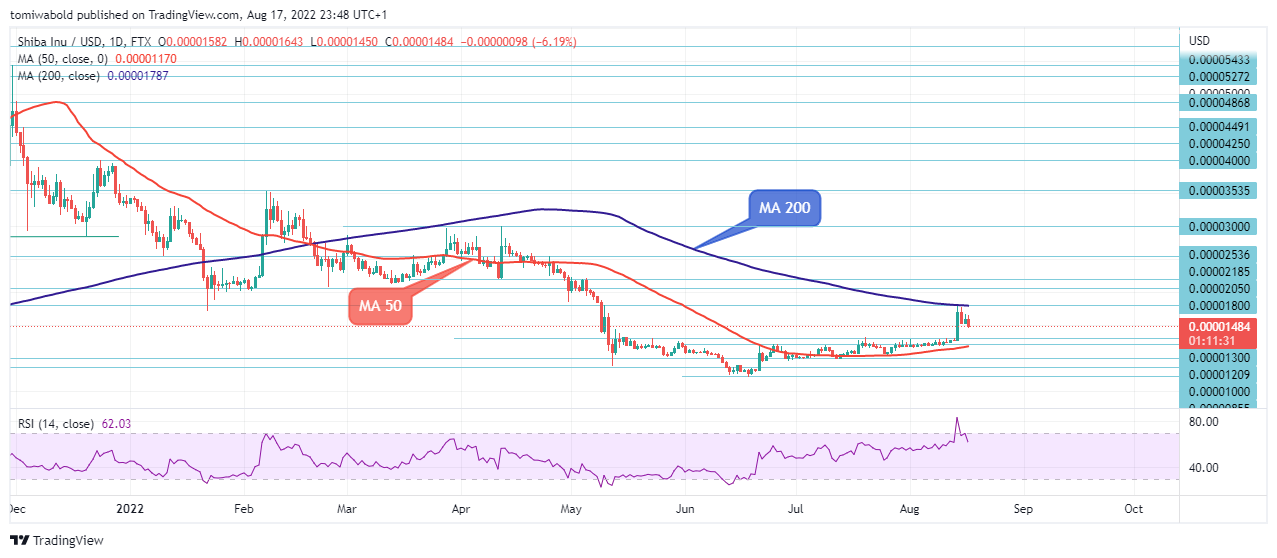 SHIB/USD Daily Chart
The SHIB/USD pair is falling beneath the moving average (MA 200) on Wednesday after reaching the $0.00001792 level early in the week amid the range trading circumstances. As of this writing, the pair was trading at $0.00001479, in the 4-month range, and its down 6.77 percent on the day.
A break of the $0.00001792 resistance zone, on the other hand, would indicate a return to higher ground and point to the crucial $0.00002000 resistance level for a re-test. A major break of the $0.00001300 support level, on the other hand, would be an early indication of a trend reversal and a return to the MA 50 at the $0.00001209 support level for validation.
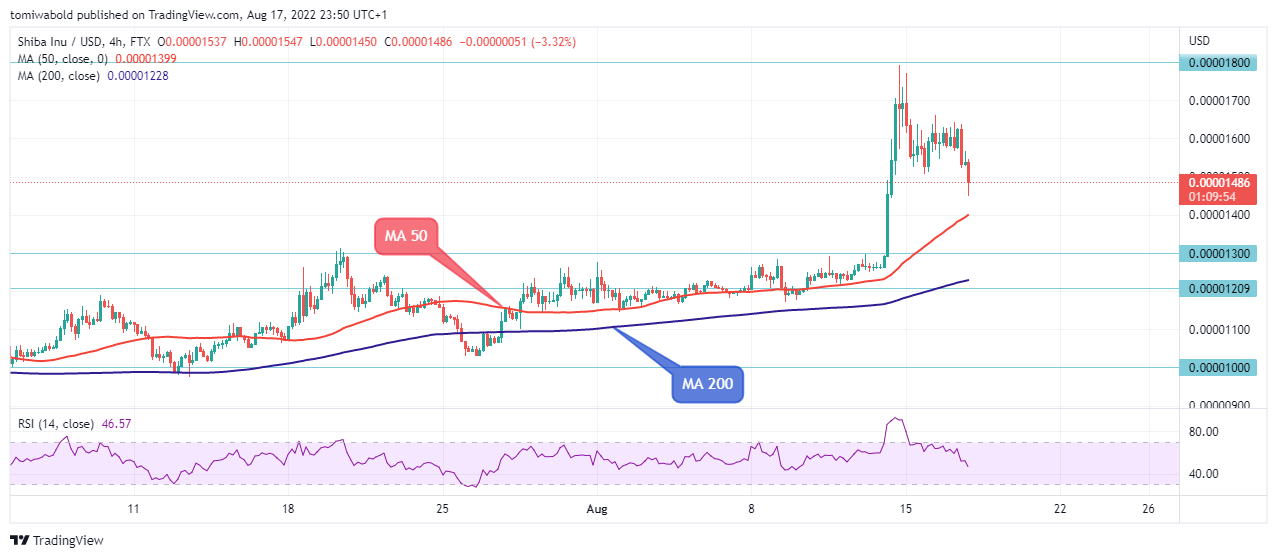 SHIB/USD 4-Hour Chart
The SHIB/USD is expected to decline further amid its resistance at $0.00001800. The most recent gain from $0.00001300 is regarded as another rebound phase of the pattern. The intraday trend is range-bound, with resistance at $0.00001650. Otherwise, a greater rebound might keep the trend optimistic.
The breach may approach the high of $0.00001792 above the intraday high of $0.00001643. A break of the minor support level of $0.00001400 at a 4-hour moving average (MA 50), on the other hand, would result in a negative inclination toward the support level of $0.00001300. At the moment, the SHIB/USD pair appears to be susceptible to further drops.
Note: Kryptomoney.com is not a financial advisor. Do your research before investing your funds in any financial asset or presented product or event. We are not responsible for your investing results
Image Credit: Shutterstock


Keep in mind that we may receive commissions when you click our links and make purchases. However, this does not impact our reviews and comparisons. We try our best to keep things fair and balanced, in order to help you make the best choice for you.