The cryptocurrency market plunged drastically on Tuesday as widespread selling pressure hit across the board. Solana (SOL) was one of the few digital assets that withstood the selling pressure as bulls remained unyielding. At the time of post, SOL was still trading in green at $174, up 6.83% in the last 24 hours and 54.49% weekly. With a present market valuation of $50.26 billion, Solana has flipped XRP to rank 6th largest in cryptocurrency ranking by market capitalization. Solana’s reduced gas fees have made it an emerging player in the NFT industry, backed by the launch of dedicated digital collectibles marketplaces such as Solanart, DigitalEyes, and its integration into music streaming platform Audius. On Sept. 6, Sam Bankman-Fried, CEO of crypto derivatives platform FTX had announced Solana’s integration into FTX’s upcoming nonfungible token (NFT) marketplace, also boosting the bullish sentiment.
Key Levels
Resistance Levels: $260.00, $240.00, $215.08
Support Levels: $128.06, $102.65, $84.50
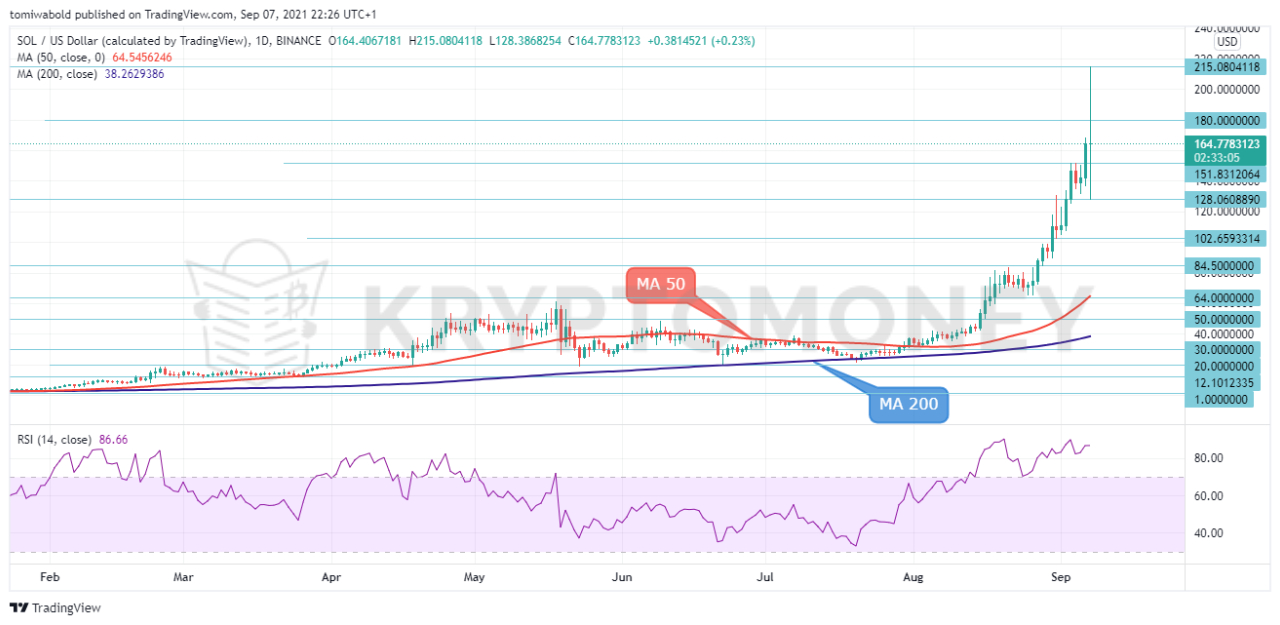 SOL/USD Daily Chart
Before the bearish wave struck in the market, Solana had rallied by nearly 67% to all-time highs of $215.05. Solana is currently consolidating gains, nonetheless, sentiment remains bullish with signs of overextension. A price correction may unfold in the very short term as the RSI hovers in the overbought territory.
If sellers rally down, the $128 low would be the first test before the support range from $98 to $64 at the MA 50 shifts into the spotlight. On the upside, the $300 level would be the next target if the bulls can keep up with the momentum. However, a sustained breakthrough above the $215 high is needed to generate an initial signal of bullish continuation.
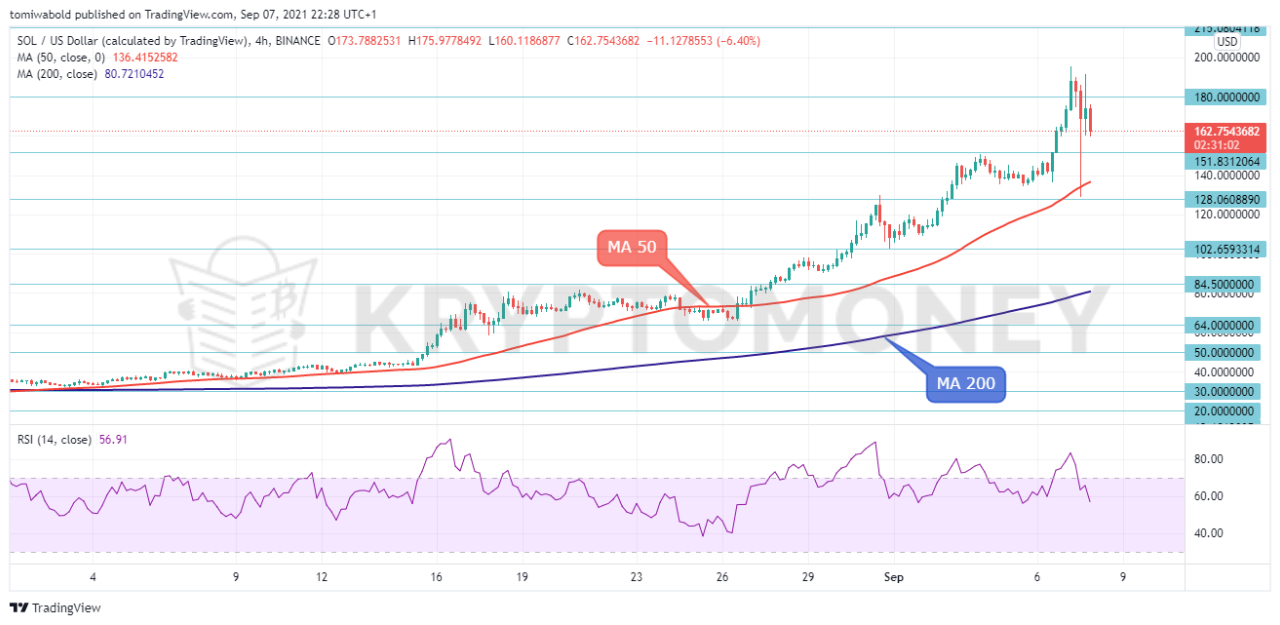 SOL/USD 4-Hour Chart
Tuesday’s trading session was a volatile one for the cryptocurrency market, however, Solana bulls haven’t yielded much ground. The picture on Solana’s 4-hour chart remains that of consolidation, with the RSI around the 50 neutral levels. That said, the bears may not win dominance unless they successfully breach the floor at the MA 50 at around $136, in which case the $129 level could immediately catch the fall if it continues further.
In the positive scenario, if the SOL price ticks higher above current levels, the bulls may push harder to drift beyond the present range with the scope to rise above the $215 high. Beyond here, SOL price will drift into uncharted territory with a focus on the $300 and $350 levels. Summing up, the short-term bias is looking neutral to bullish for Solana as long as the pair consolidates its rally between the $129 and the $215 level. A violation of these boundaries could set the next direction in the market.
Note: Kryptomoney.com is not a financial advisor. Do your research before investing your funds in any financial asset or presented product or event. We are not responsible for your investing results
Image Credit: Shutterstock


Keep in mind that we may receive commissions when you click our links and make purchases. However, this does not impact our reviews and comparisons. We try our best to keep things fair and balanced, in order to help you make the best choice for you.