Solana is up 10% in the last 24 hours at $37.89, per CoinMarketCap data. Solana Mobile, a subsidiary of Solana Labs, debuted today Solana Mobile Stack, an open-source software toolkit for Android enabling native Android web3 apps on Solana. Solana Mobile Stack was introduced at an event in New York today, which also included the introduction of Saga, a flagship Android mobile phone with unique functionality and features tightly integrated with Solana, and is available now for pre-orders for delivery in early 2023. Solana Mobile is a mobile technology company developing the Solana Mobile Stack and Saga. To help kickstart a new mobile ecosystem, the Solana Foundation has started a $10 million fund to encourage the growth of mobile dApps.
Key Levels
Resistance Levels: $75.00, $60.00, $40.00
Support Levels: $33.50, $26.00, $20.00
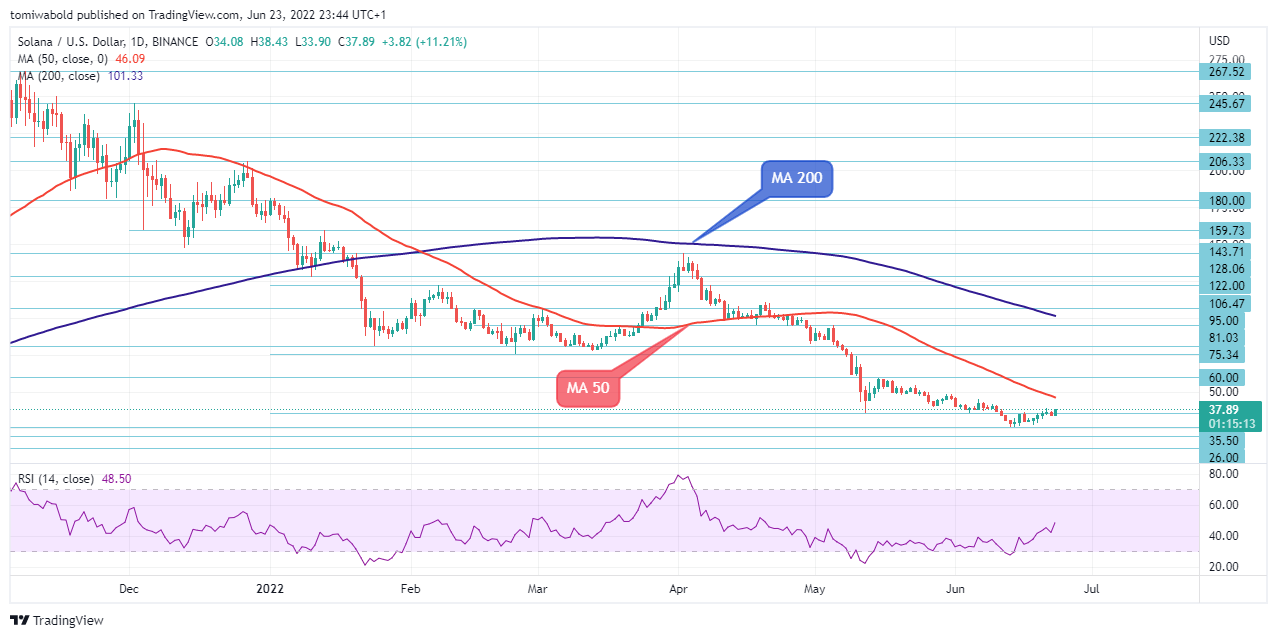 SOL/USD Daily Chart
The SOL/USD support level around $26.00 on the daily chart is still in place, and if the pair returns in an attempt to break below it, it might pave the way for a test of lower levels. The pair have been staying steady in a constrained trading range between $26.00 and $60.00 for more than 10 days.
Therefore, the likelihood of a near-term bullish reversal may be increased by a firm breach of the daily moving average (MA 50) at $46.30. A key resistance level of $60.00 may then come into focus for validation. Alternately, a downward breach of the multi-day support line, which was previously tested near the level of $26.00, would need to occur to dampen the rebound sentiment for sellers to re-enter.
 SOL/USD 4-Hour Chart
Initial intraday bias for the SOL/USD is neutral. As long as the level of moderate resistance remains at $40.00 and a 4-hour moving average (MA 200), further falling may continue to be somewhat favorable. It may be assumed that the complete rebound from $26.0 support is ongoing if the barrier at $40.00 is consistently broken.
A breach of the near-term support level at $33.50 and a 4-hour moving average (MA 50), though, might make the downward bias stronger and trigger a quick sell if the momentum is to the downside. The absence of any meaningful levels of resistance in the interim might result in continued deterioration of the bears above the $35.50 level.
Note: Kryptomoney.com is not a financial advisor. Do your research before investing your funds in any financial asset or presented product or event. We are not responsible for your investing results
Image Credit: Shutterstock


Keep in mind that we may receive commissions when you click our links and make purchases. However, this does not impact our reviews and comparisons. We try our best to keep things fair and balanced, in order to help you make the best choice for you.