Chainlink has been the highlight of the crypto market since the beginning of August and has continued to suffer declines this week after hitting new all-time highs around $20 last week. The selling pressure surrounding major cryptocurrencies on Friday caused LINK to further fall sharply and close the day with a 13.86% loss. However, the price met stiff support and made a sharp U-turn to the upside. The retreat is mainly a correction with Bulls defending support as LINK/USD price returns past $15. Technicals for the LINK/USD have remained in the bullish territory since a March drop, with price holding well above MA 50 and MA 200. The LINK market cap currently stands at $5.37 billion, based on a 350 million circulating token supply, with $2.39 billion in trade volume over the past 24 hours. Popular game – based crypto exchange site, Hxro, has teamed up with Chainlink offering Hxro’s .xBTC and .xETH indices with reference pricing. This is a pivotal step because it is the first live integration where a centralized trading platform employs as a reference price a decentralized on-chain market feed.
*Technicals for the LINK/USD have remained in the bullish territory since a March drop, with price holding well above MA 50 and MA 200
*The retreat is mainly a correction with Bulls defending support as LINK/USD price returns past $15
*Popular game – based crypto exchange site, Hxro, has teamed up with Chainlink offering Hxro’s .xBTC and .xETH indices with reference pricing
Key Levels
Resistance Levels: $20.00, $18.00, $16.00
Support Levels: $15.00, $12.01, $10.30
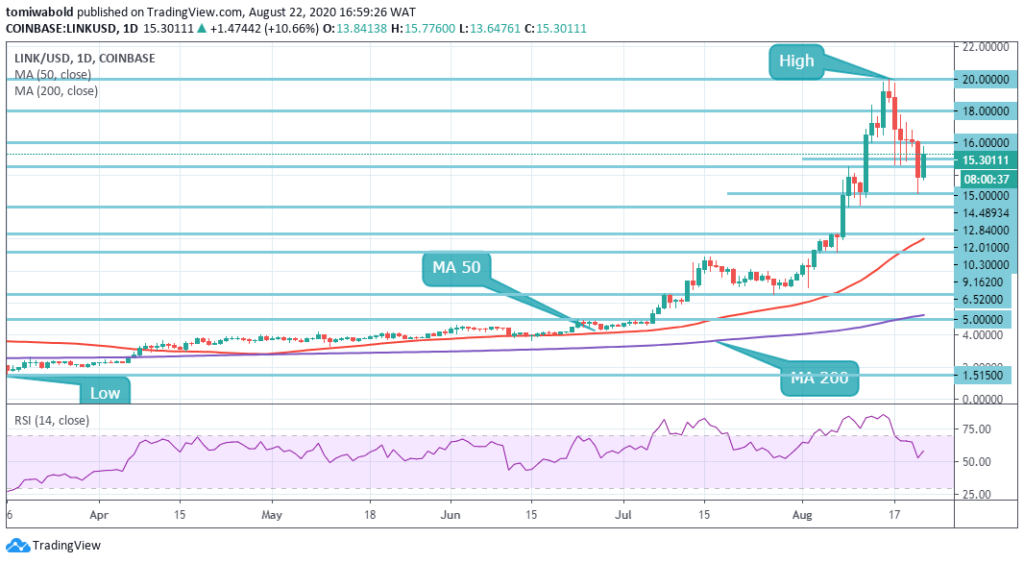 LINK/USD Daily Chart
Furthermore, as posited on the daily, ChainLink price fell from its $20 high, buyers aren’t rattled just as this seems to be a healthy phase of consolidation. Trading volume grows while suggesting the bounce may be valid. The daily moving averages (MA 50 and MA 200) indicate the market momentum at its bullish bias is currently stable.
The daily RSI has substantially eased off from its midlines up to around 60 at present. LINK price has bounced from a minor support zone of $12.84 and has pushed bulls past the threshold of $15, which may act as strong support going forward. It is crucial to note that the last low is down at $12, which implies anything beyond this level of support is deemed a higher low and a continuation of the uptrend of the day.
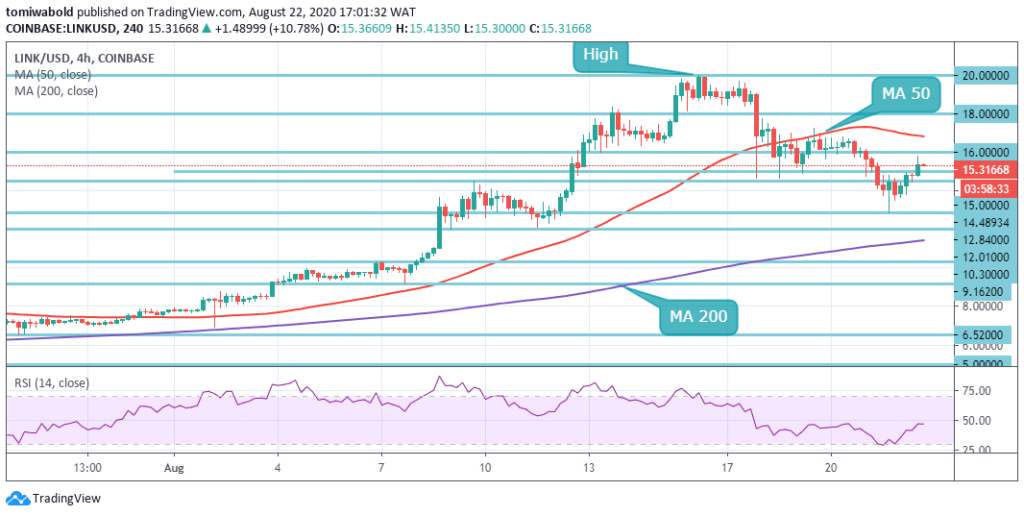 LINK/USD 4-Hour Chart
At the time of writing, LINK/USD has extended the rebound action to test minor resistance zone formed by the horizontal line in the 4-hour range around $16.00. Chainlink bulls are already building up the momentum above the initial support at $15. The hunt for support has not been easy considering that tentative levels around $18 and $16 failed to hold the price. From a technical point, LINK is mainly consolidating its position for a renewed upside journey.
A breakout beyond the $16.00 level is required to re-activate the bullish pattern with an $18.00 upside target. The LINK/USD pair is only bullish while trading above the $15.00 level, key resistance is found at the $16.00 and the $18.00 levels. If the LINK/USD pair trades below the $15.00 level, sellers may test the $12.01 and $10.30 levels.
Note: Kryptomoney.com is not a financial advisor. Do your research before investing your funds in any financial asset or presented product or event. We are not responsible for your investing results
Image Credit: Shutterstock


Keep in mind that we may receive commissions when you click our links and make purchases. However, this does not impact our reviews and comparisons. We try our best to keep things fair and balanced, in order to help you make the best choice for you.