
October is starting on a positive note as bears scurried to close their short positions. The majority of assets are trading in the green, Theta (THETA) is up 9.24% in the last 24 hours and 21.01% on a 7-day basis. At the time of writing, THETA traded at $6.25 with a market capitalization of $6.22 billion. Theta trended lower after reaching all-time highs of $16.61 in April and thereby entered into consolidation. October is known for depicting bullish reversals, will Theta bulls line up for a breakout? The $9.81 level remains the line in the sand for bulls. On October 1, Theta Labs announced the release of “Theta Video API”, a new product powered by Theta’s native TFUEL token for developers that allows them to add Web 3.0 decentralized video to any website or application without any central servers, content delivery, or video hosting software.
Key Levels
Resistance Levels: $12.00, $10.58, $8.00
Support Levels: $5.50, $4.50, $3.50
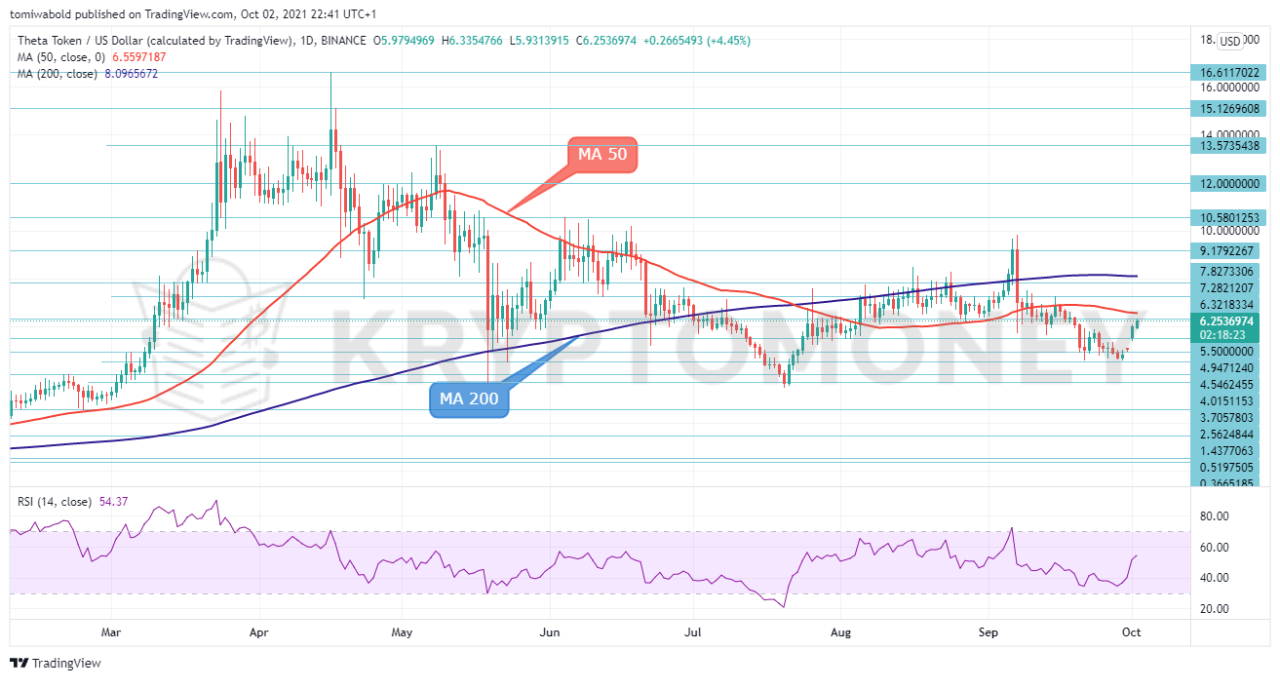 THETA/USD Daily Chart
THETA made a bounce from lows of $4.65 on Sept. 29 and is gradually approaching the MA 50 at $6.55. This is significant as THETA price had tried to hold above the MA 50 on at least two failed counts since Sept.15.That said, The journey for the bulls towards the April all-time highs of $16.61 may be one filled with hurdles. Thus, an upside run above the MA 50 ($6.55) and $7.50 may signal a breakout to drive the price towards the MA 200 at $8.09.
Even higher, THETA/USD could see a pause near the $8.48 resistance, ahead of the $9.81 critical barrier. A major breakout above the $9.81 level could kickstart the beginning of a new bull trend. The RSI indicator seems to be making its way up above the 50-neutral mark. On the downside, the immediate support level below the MA 50 is coming from the $5.69 level and any violation of this barrier could open the way for $4.61 and $3.49 levels
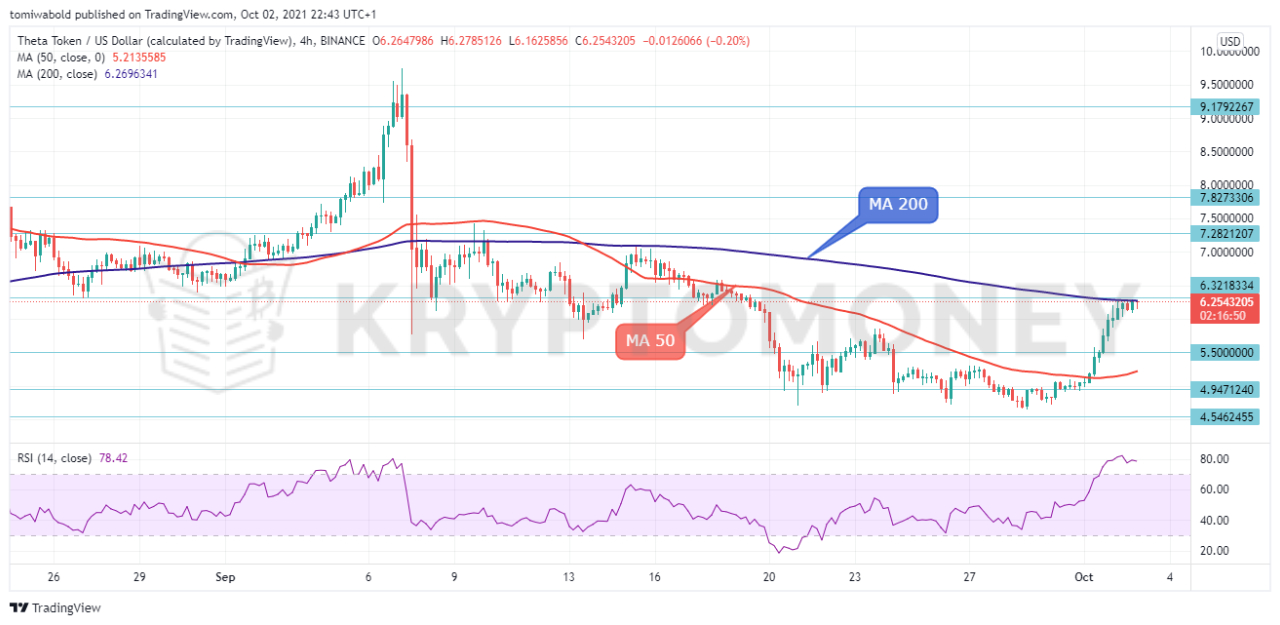 THETA/USD 4-Hour Chart
Theta rebounded on the $4.66 level and 4-hour MA 50 at $5.21, shifting back to the upside. However, the price is battling resistance at the MA 200 at $6.27 and the emanating pressure is restricting further upside moves. To the upside, if buyers manage to jump above the MA 200, a revisit to the Sept. 7 high of $9.81 could unfold.
Overcoming these constrictions could see resistance develop at the $11 and $13 psychological levels. On the other side, a downside move could find support at the MA 50 at $5.21 ahead of the $4.66 level. Overall, Theta remains in consolidation over the last few months and only a decisive close above $6.27, and the $8.09 level could switch this outlook to bullish again.
Note: Kryptomoney.com is not a financial advisor. Do your research before investing your funds in any financial asset or presented product or event. We are not responsible for your investing results
Image Credit: Shutterstock


Keep in mind that we may receive commissions when you click our links and make purchases. However, this does not impact our reviews and comparisons. We try our best to keep things fair and balanced, in order to help you make the best choice for you.