Due to the drastic potential loss in March 2020, TRX represents one of the leading, best known, and most widely traded cryptocurrencies globally. Often by market capitalization, it is among the top 20 cryptocurrencies. TRX has a total $1.2 billion market cap, with an estimated daily trading volume of $400 million. In the past 24 hours, the coin has risen by 2 percent and has held steady since the start of the day. A mild bullish bias on TRX/USD is evolving after the recent drop as price stays in range past $0.0170. TRX/USD increases in value at $0.0175 at the time of writing. The BTSE crypto-currency exchange added TRON (TRX) to the tradable Instruments list. The exchange users can now buy and sell TRX through BTSE’s All-In-One order book and fund their BTSE Debit Card with TRX. The card is universally recognized at more than 53 million merchants.
*In the past 24 hours, the coin has risen in 2 percent and has held steady since the start of the day
*A mild bullish bias on TRX/USD is evolving after the recent drop as price stay in range past $0.0170
*The BTSE crypto-currency exchange added TRON (TRX) to the tradable Instruments list
Key Levels
Resistance Levels: $0.0215, $0.0200, $0.0180
Support level: $0.0170 $0.0154, $0.0130
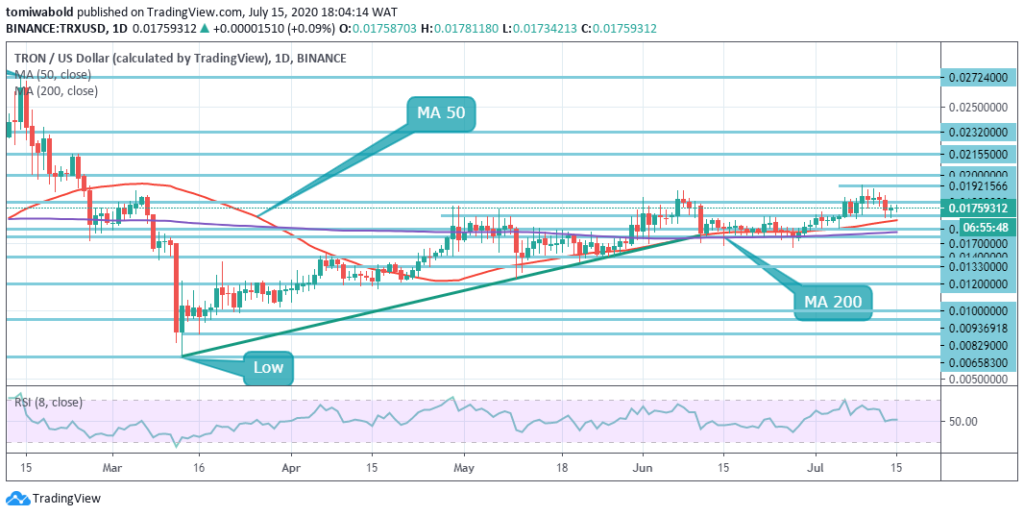 TRX/USD Daily Chart
TRX/USD is hovering at $0.0175 at the time of writing and struggling to smash through the horizontal resistance level at $0.0180 higher. Gains are likely to grow in the medium to long term with indicators such as the MA 50 rising beneath the price upwards. The MA 50 is above the lifting level of the MA 200, as bulls exhibit greater capacity than bears.
TRON may ultimately move beyond $0.02 if the optimistic technical context remains intact. And on the flip side, selling may intensify if prices were to fall beneath the near-by swing low at $0.0160 around the MA 200 where additional selling stops may be enabled. The bulls instead need to gain power beyond the resistance level of $0.0180 to maintain the resurgence upside activity.
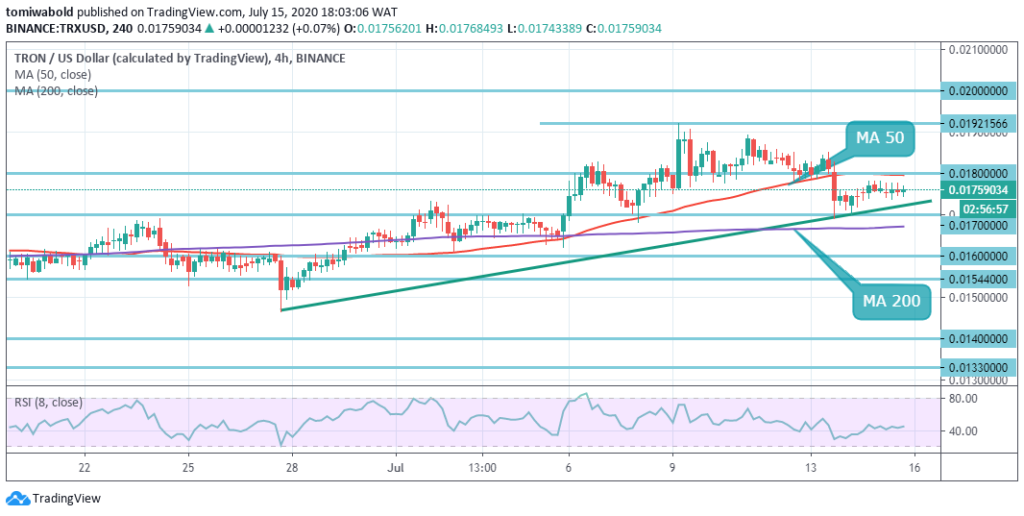 TRX/USD 4-Hour Chart
In the short time frame, TRON’s technical analysis shows that, once the established short-term trading range is broken, the TRX/USD pairing may launch a major breakout. On the 4 hours ascending trendline, the token has increased marginally, staying well supported on any dips.
If buyers break out through the $0.0180 technical zone, the TRX/USD may rally towards the $0.020 mark. Investors may consider that if bulls fail to move price beyond the horizontal resistance level at $0.0180, technical sellers may be incentivized towards $0.0170 and beneath. In its progress sideways the trend is increasing, displaying an intact range in the short term.
Note: Kryptomoney.com is not a financial advisor. Do your research before investing your funds in any financial asset or presented product or event. We are not responsible for your investing results
Image Credit: Shutterstock


Keep in mind that we may receive commissions when you click our links and make purchases. However, this does not impact our reviews and comparisons. We try our best to keep things fair and balanced, in order to help you make the best choice for you.

