
The markets had struggled to stay afloat but then during early September, Tron pulled out with a 45 percent price leap even as the overall crypto market was declining. TRX ultimately fell, but owing to positive fundamentals, it has been able to rebound stronger. A simple steady-state trend with a lower high and a higher low has been established by the TRX price. Following a retracement, price ticks up on TRX/USD with fresh momentum towards $0.03 as volatility is set to rise. Buyers may have to breach the MA 50 barrier on $0.028, to pull out again from the trend towards $0.03 lower high zone. The crypto asset is currently 15th on the Coinmarketcap table, with a market cap of $1.94 billion and $1.43 billion in trade volume over the past 24 hours. These increases, though promising, require defense beyond the price level of $0.027, with TRX currently trading at $0.0273. As per a recent report shared by the TRON Foundation CEO, Justin Sun the circulating amount of USDT on the Tron chain now totals more than 4 bln. The current balances on the Tether Transparency page show the precise amount of the asset with over $4,245,584,534 Tron-USDT in circulation.
*Following a retracement, price ticks up on TRX/USD with fresh momentum towards $0.03 as volatility is set to rise
*Buyers may have to breach the MA 50 barrier on $0.028, to pull out again from the trend towards $0.03 lower high zone
*As per recent report shared by the TRON Foundation CEO, Justin Sun the circulating amount of USDT on the Tron chain now totals more than 4 bln
Key Levels
Resistance Levels: $0.037, $0.033, $0.030
Support Levels: $0.024, $0.022, $0.018
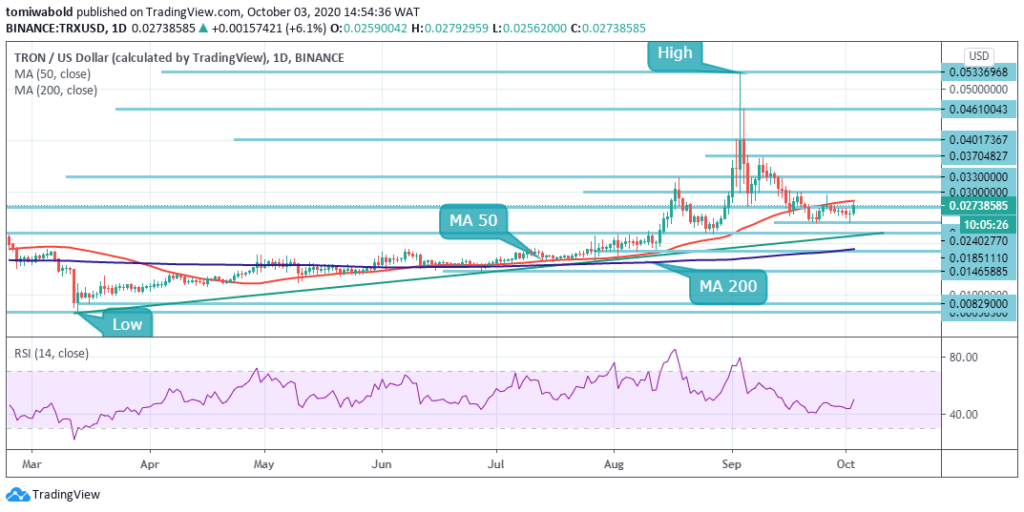 TRX/USD Daily Chart
As of now, TRX has rebounded up from a low of $0.024 to $0.0279 presently. Admittedly, the last high was established at $0.0293, which implies that anything beneath this level may only reflect a lower high, and the downtrend may proceed until bulls breach the MA 50 barrier on $0.028, to pull out again from the trend towards $0.03 setting up a new lower high zone.
On the other side, if the support level continues to hold firm at $0.024, we might see TRX/USD in the near-term progress beyond the $0.028 MA 50 barrier. Far past MA 50 hurdles on the daily chart, a longer-term price target will be $0.030. The RSI, which is on the brink of flipping bullish past midlines, is to connect to the latest upside momentum.
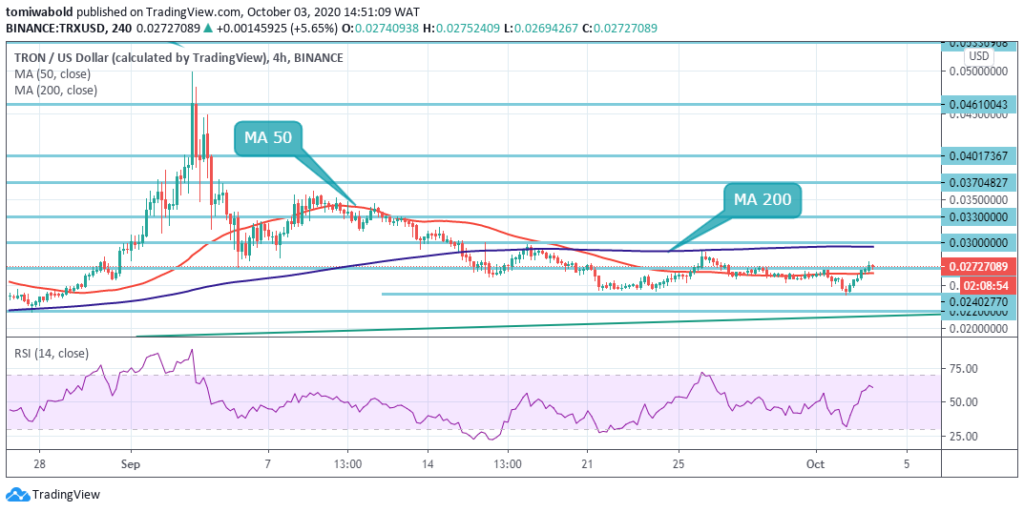 TRX/USD 4-Hour Chart
Although trading within 4 hours of MA 50 and MA 200, the price lacked a bullish breakout from the ranging channel. The price has fallen to the $0.024 horizontal support level after losing momentum at the $0.029 level, dipping beneath the MA 50 line in the course. In the short term, however, TRX/USD bulls are on track at $0.028 and $0.03 levels to reverify and breach the MA 200.
The RSI is floating around 63, so before reaching the overbought mark, it still has some extra space to travel. If Tron dips beneath $0.027 directly into the 4 hour MA 50, the bearish trend may proceed. The next level of support would be $0.024, followed at the $0.022 level by horizontal low support. Although the token trades beyond the $0.027 mark, the TRX/USD pair is likely to stay under technical buying pressure.
Note: Kryptomoney.com is not a financial advisor. Do your research before investing your funds in any financial asset or presented product or event. We are not responsible for your investing results
Image Credit: Shutterstock


Keep in mind that we may receive commissions when you click our links and make purchases. However, this does not impact our reviews and comparisons. We try our best to keep things fair and balanced, in order to help you make the best choice for you.
