TRON is one of the leading cryptocurrencies. Although not in the current top 10 cryptocurrencies, the TRON Protocol is being presented as one of the world’s largest blockchain-based operating systems. TRON (TRX) price is presently trading down approx $0.029, after hitting new $0.033 highs in the current session. The growth in trading volume was notable after a whole week of gains for TRON but several indicators are now heavily overstretched. TRX/USD has seen its value increase by at least 15 percent in the last 24 hours. Amid the surge, the price dips as upside barrier caps TRX/USD rallies to fresh year highs of $0.0327. Justin Sun and the TRON Foundation on August 18 in a Livestream event introduces JustSwap to users of JUST (JST) and the TRON ecosystem. The digital asset TRX has had an impressive run in the crypto markets as JustSwap goes live on TRON Blockchain. JustSwap is the first decentralized token exchange protocol on TRON (TRX) allowing users to exchange TRC20 tokens as well as earn trading fees and mining rewards.
*TRX/USD has seen its value increase by at least 15 percent in the last 24 hours
*Amid the surge, the price dips as upside barrier caps TRX/USD rallies to fresh year highs of $0.0327
*The digital asset TRX has had an impressive run in the crypto markets as JustSwap goes live on TRON Blockchain
Key Levels
Resistance Levels: $0.040, $0.035, $0.033
Support Levels: $0.027, $0.025, $0.020
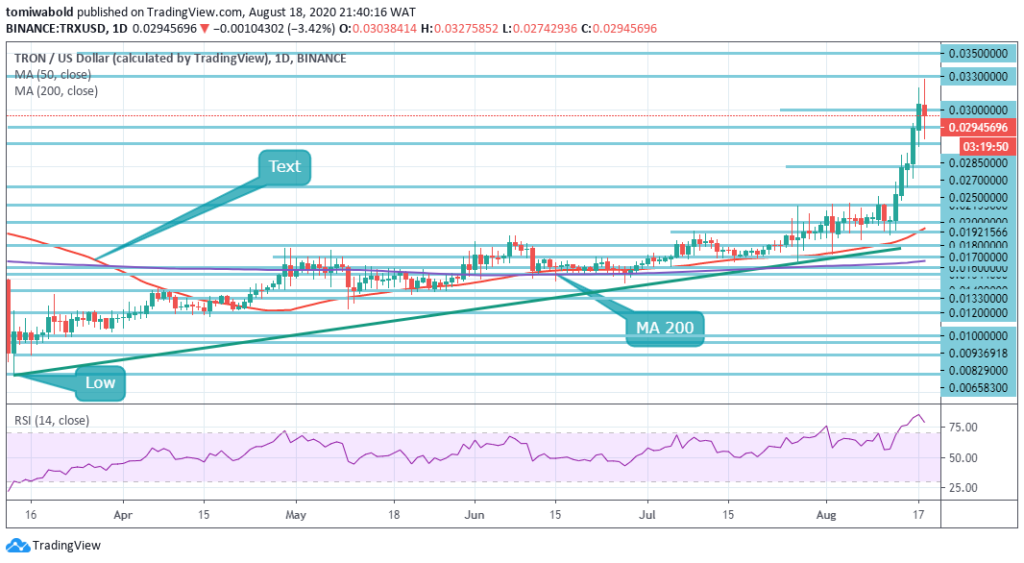 TRX/USD Daily Chart
A look at the daily chart reveals a steady fast trajectory from the pivotal $0.020 in August’s first week to highs of $0.0327 (monthly high). The technical context emphasizes the firm grasp the bulls have on the price. The RSI is in the overbought region but is now trying to consolidate a rally upwards. This suggests that buying pressure is at the top of the chain, and in the medium to long term, more price actions toward the north are anticipated.
It is evident that in anticipation of the run-up to $0.04 in the medium term, a breach beyond $0.035 may trigger further buying activities. Whenever push comes to shove, after all, and a correction is made from the present price level, TRX/USD may attempt support at $0.027, $0.025, $0.020, the MA 50, and the ascending trendline support.
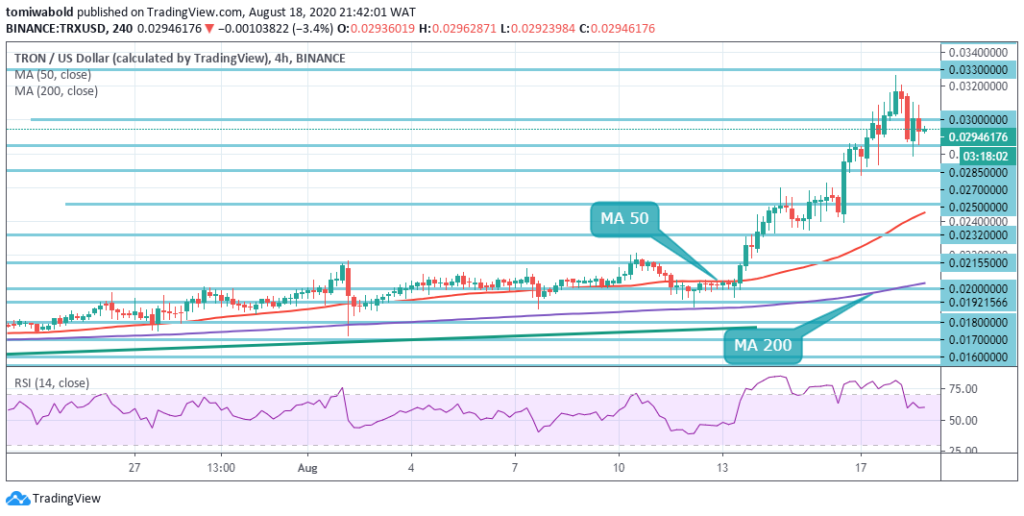 TRX/USD 4-Hour Chart
TRX has been on an upward path as seen on the 4-hour chart A slight reversal saw TRX/USD validate support at $0.0285, after reaching a fresh yearly high at $0.0327. Consolidation is ongoing with trading slightly beyond $0.029. Looking upward, resistance is anticipated at $0.0300, and the critical barrier at $0.033, respectively. A breach through this resistance level may lead to the start of the path to extend towards $0.035 and $0.040.
Unless bulls continue to hold prices beyond the level of $0.030, then the TRX/USD pair may start correcting lower as traders take profits. The TRX/USD pair is only bullish while exchanging beyond the level of $0.025, the main resistance is seen at levels between $0.033 and $0.035. Sellers may test the $0.0270 and $0.025 levels once the TRX/USD pair exchanges beneath the $0.030 level.
Note: Kryptomoney.com is not a financial advisor. Do your research before investing your funds in any financial asset or presented product or event. We are not responsible for your investing results
Image Credit: Shutterstock


Keep in mind that we may receive commissions when you click our links and make purchases. However, this does not impact our reviews and comparisons. We try our best to keep things fair and balanced, in order to help you make the best choice for you.
