
Uniswap (UNI) jumped as much as 21% after trading app Robinhood announced the listing of Uniswap’s native UNI token on its platform. At the time of publication, Uniswap was changing hands at $6.95, up 21.85% in the last 24 hours and 22% in the past week. Uniswap ranks as the 18th largest cryptocurrency with a market capitalization of $5.57 billion. On July 13, some Uniswap LPs, unfortunately, fell for a phishing scam, as a phisher airdropped malicious tokens to Uniswap LPs’ wallets. The name of the token directed users to a malicious interface that claimed users could swap these tokens for UNI. Uniswap debunks the claim that there was no exploit, as the Protocol is always secure. Celo is now available on the Uniswap interface, joining ethereum, optimism, arbitrum, and Polygon.
Key Levels
Resistance Levels: $12.50, $10.00, $7.50
Support Levels: $5.00, $3.50, $1.65
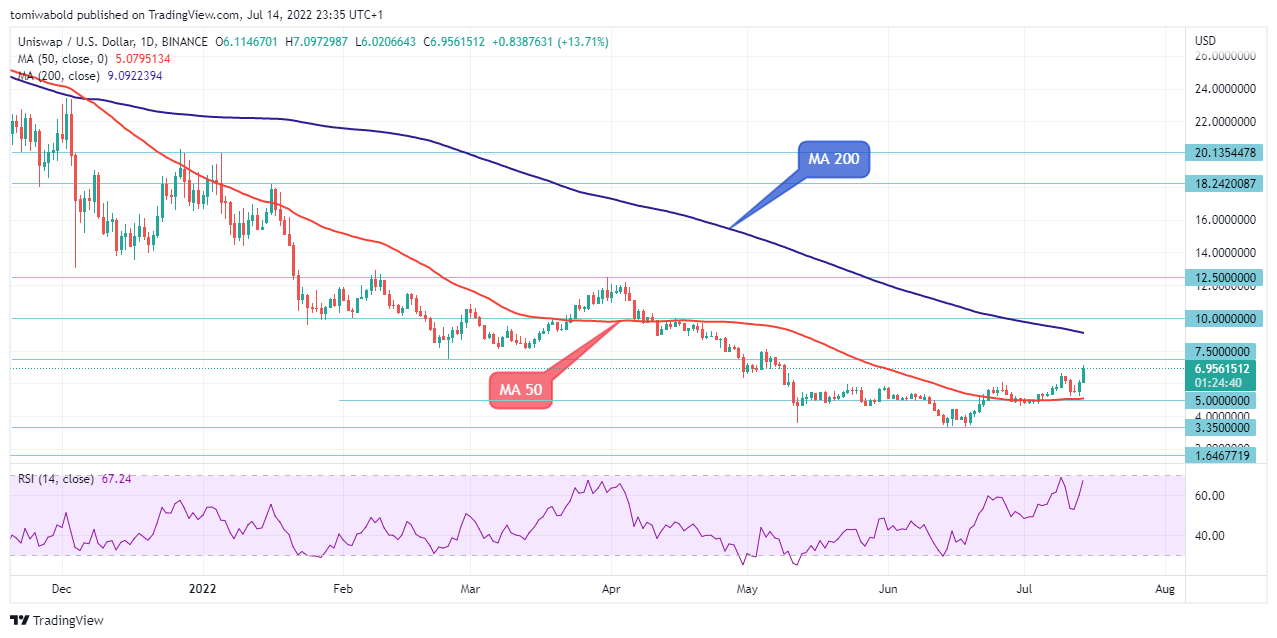 UNI/USD Daily Chart
The UNI/USD pair might attempt to break through the $7.50 mark as bullish forces gain the upper hand to reach an intraday high of $7.09. The moving average (MA 50) remains stable support for the pair at $5.10. The $10.0 barrier, followed by the $12.50 zone, would be the target of a breach past the daily moving average (MA 200) at $9.20 in price.
The major resistance level is still found at $9.20, above the present intraday high of $7.09. As the RSI seeks to sustain in the buying zone above the 50 neutral points, it’s important to keep an eye on the shrinking gap between the moving averages. A move lower might occur, with the $5.0 level being tested and the MA 50 at $5.10 being removed, perhaps opening the door for a retest of the $3.35 level.
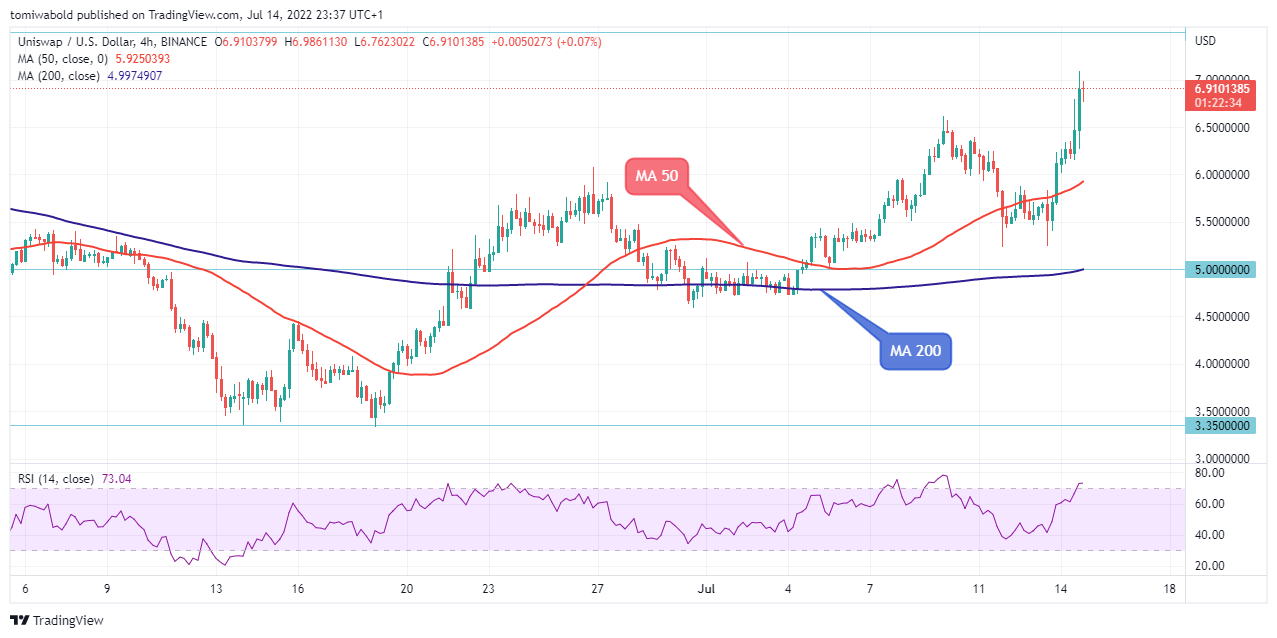 UNI/USD 4-Hour Chart
The UNI price bounced on July 13 after briefly consolidating in the $5.50 to $6.00 area, breaking above its 4-hour MA 50 at $5.80 to break above the round figure of $6.00. low. Since then, Uniswap has surpassed the prior resistance level of $6.613 to reach the $7.09 high. A further breakout to the upside above its intraday high would pave the way for the round figures of $8.00 and $10.00.
On the other hand, a new wave of losses could begin if the advance stalls beneath the $7.0 level and a close beneath the moving average (MA 50) at $5.80 is recorded. A bearish break on the current low at $5.22 might open the door for a test of the 4-hour moving average (MA 200) at $5.00.
Note: Kryptomoney.com is not a financial advisor. Do your research before investing your funds in any financial asset or presented product or event. We are not responsible for your investing results
Image Credit: Shutterstock


Keep in mind that we may receive commissions when you click our links and make purchases. However, this does not impact our reviews and comparisons. We try our best to keep things fair and balanced, in order to help you make the best choice for you.
