VeChain (VET) is the 19th largest digital asset with an average daily trading volume of $172 million and a recent market cap of $1.03 billion. On a day-to-day premise, the coin has reached almost 5 percent, which is the second-best out of the top-20. Upside recovery on VET/USD stays afloat past $0.0185 from the downturn caused by a huge cryptocurrency sell-off on July 10. VET/USD shifts the price at $0.0188 at the time of this post. VeChain is the most recent target on YouTube for the classic fake Livestream airdrop. The Livestream has 38,000 viewers at the time of this report, offering to give back half a billion VET tokens. Viewers sending VET tokens to the QR code on-screen are guaranteed five times their deposit, plus rewards for those sending 100,000 VETs or above. Just over 320,000 VETs were transferred from just three people and disturbingly, yet no tokens have been restored which posit a loss of $5,800.
*On a day-to-day premise, the coin has reached almost 5 percent, which is the second-best out of the top-20
*Upside recovery on VET/USD stays afloat past $0.0185 from the downturn caused by a huge cryptocurrency sell-off on July 10
*VeChain is the most recent target on YouTube for the classic fake Livestream airdrop
Key Levels
Resistance Levels: $0.0250, $0.0222, $0.2000
Support Levels: $0.0169, $0.0137, $0.0100
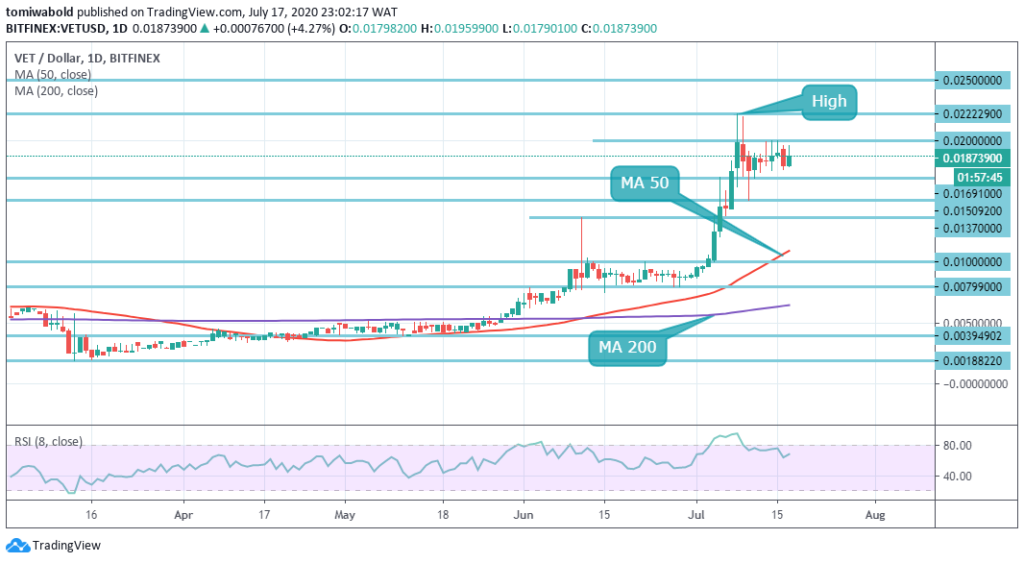 VET/USD Daily Chart
VeChain has recently recovered from the decline brought about by a major sell-off on the cryptocurrency market. The token bottomed at $0.0169 and has since regained strength. Before the profit-taking pushed the price to the present level, the price reached the intraday high at $0.0190. The daily uptrend is still intact but in the near term, bulls lost a lot of energy.
Given the rebound, VeChain isn’t out of danger fully. After observing the RSI, technical signals suggest that activity for selling remains ongoing. In the negative zone, the MA 200 is trapped. Consequently, there is a bearish divergence between the MA 50 and the RSI which underlines the solid influence of sellers. Thus VET/USD may keep beyond $0.0815 but the MA 200 tends to lag.
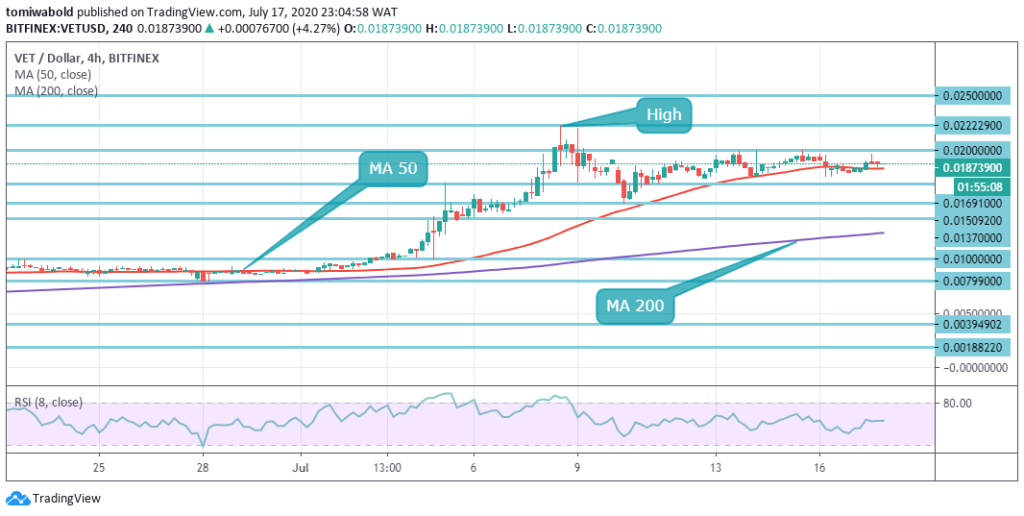 VET/USD 4-Hour Chart
The short-term VET trend stays bullish on the 4-hour chart as long as it holds at $0.0169 beyond the horizontal support line. Once breached, the sell-off may be extended to $0.0150, which is the lower boundary of the recent channel of consolidation.
On the positive side, a continuous push beyond $0.0195 intraday high is required to open the path to psychological $0.02, led by $0.0222, the recent high recovery achieved on July 8. VeChain bulls may have an ability to improve on higher levels at $0.02 as long as the 4 hour RSI holds above 50.
Note: Kryptomoney.com is not a financial advisor. Do your research before investing your funds in any financial asset or presented product or event. We are not responsible for your investing results
Image Credit: Shutterstock


Keep in mind that we may receive commissions when you click our links and make purchases. However, this does not impact our reviews and comparisons. We try our best to keep things fair and balanced, in order to help you make the best choice for you.
