While the optimistic momentum from last week’s token burn dissipated, Stellar (XLM) witnessed a significant rise this week. Stellar, currently the 13th largest digital asset with a total market cap of $860 million, has risen more than 2.5 percent in the last 24 hours to trade by press time at $0.0420. The coin has reported an average volume of $434 million in daily trading which is consistent with the latest figures. XLM/USD has a lot of growth potential whilst trading inside the triangle range with the $0.0500 price level staying in focus. The foundation launched the Stellar Development Foundation (SDF)-based Lumenthropy Project against COVID-19 using XLM tokens as a donation to several charitable organizations, UNICEF included The Tor Initiative, Press Freedom. The Foundation is urging the community to contribute to the project and send out their coins, which SDF would support.
*$0.0500 price level in focus as XLM/USD trades within triangle range
*It has risen over 2.5% in the last 24 hours to trade by press time at $0.0420
*Stellar Development Foundation (SDF)-based Lumenthropy Project against COVID-19
Key Levels
Resistance Levels: $0.0550, $0.0500, $0.0451
Support Levels: $0.0362, $0.0312, $0.0261
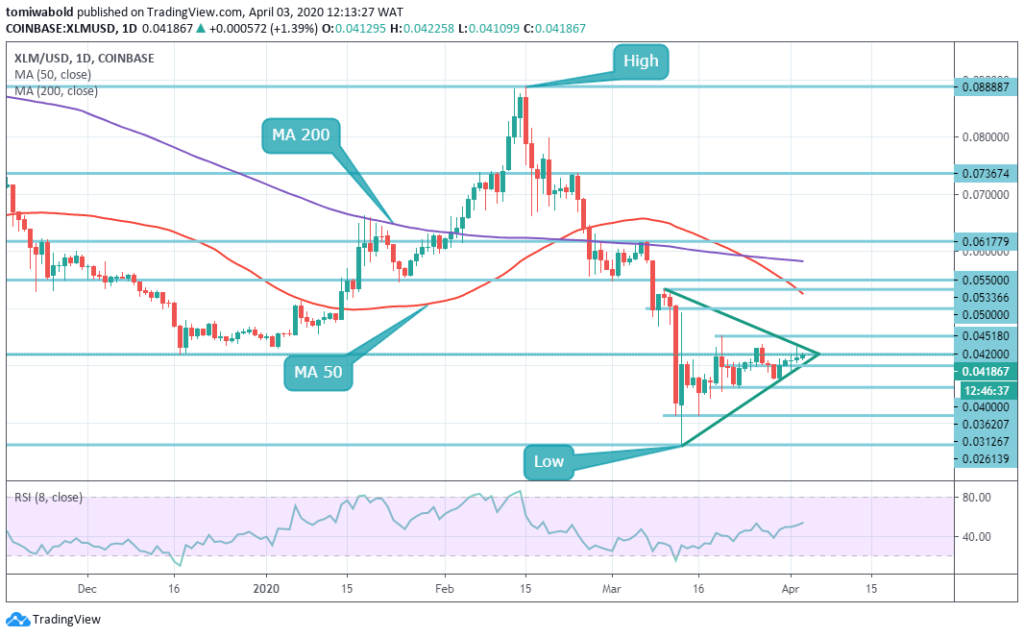
 XLM/USD shifted in line with the market. The coin hit the bottom on March 13 at $0.0261 level and has since gradually gained traction. The upper horizontal line provides the initial resistance at a $0.0451 level. Until the coin progresses in breaking this initial resistance, then rebound can be increased to a psychological level of $0.0500, led by a resistance zone of $0.0533-$0.0550 levels strengthened the daily by MA 50.
On the contrary, a continuous fall beneath the level of $0.0400 may usher in fresh speculative sellers to the market. As a response, the price may decline to the level of $0.0362 (the next lower line intersecting the ascending triangle line). Once outside the path, the psychological level of $0.0312 may get into focus followed by the recent low of $0.0261 level.
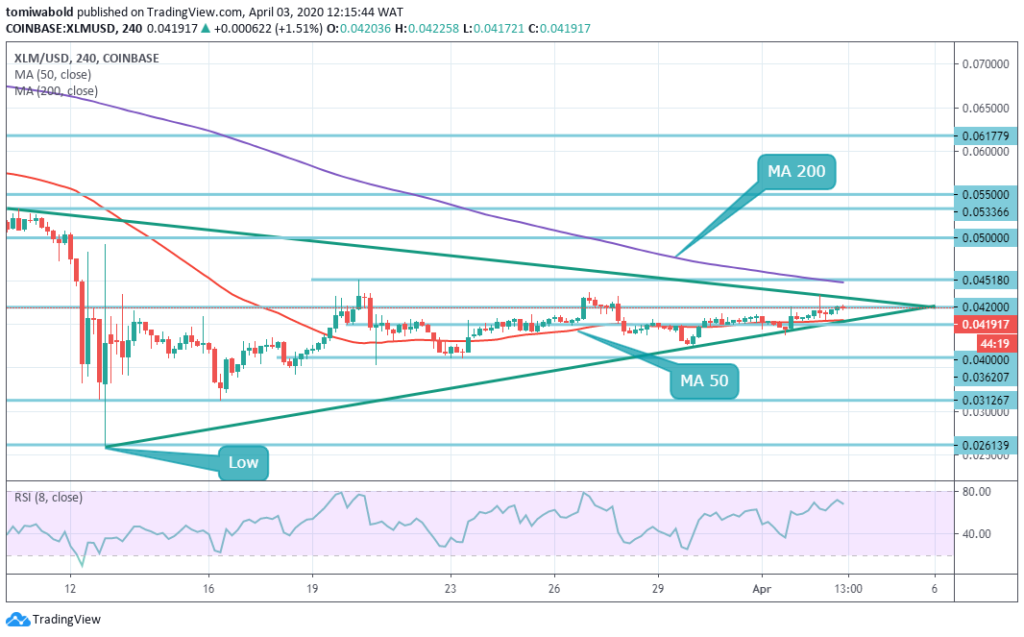
 Over the last few days, the short-term technicals for the XLM/USD pair have progressed and currently suggest a potential advance to the resistance level of $0.0451 may be on the radar. The four-hour time frame showed the cryptocurrency is currently stuck within a rising price range of the triangle. The above time frame indicates that a break above the $0.0451 level in the XLM/USD pair may spark a further $0.0500 level advance.
As a whole, the cryptocurrency appears to stabilize after the price recovered from the low level at $0.0261 to above the estimated $0.0400 levels. The top of the triangle range is about the level of $0.0451, which maintains a valid upside target if a break occurs beyond the triangle range at the upside.
Note: Kryptomoney.com is not a financial advisor. Do your research before investing your funds in any financial asset or presented product or event. We are not responsible for your investing results
Image Credit: Shutterstock
Keep in mind that we may receive commissions when you click our links and make purchases. However, this does not impact our reviews and comparisons. We try our best to keep things fair and balanced, in order to help you make the best choice for you.