
The cryptocurrency market is mostly in green, BTC rally hit new all-time highs of $35,863. After a bout of lackluster trading in December, Stellar (XLM) exploded higher today. A 31 -month high on XLM/USD was subsequently reached at $0.4399. XLM began the year 2021 with an opening price of 0.1277 after which the bulls took charge. In four straight days of bullish action, XLM rose to fresh highs of $0.43 as positive sentiment shift from Ripple’s XRP and Ukraine deal buoys Stellar. Climbing from intraday lows of $0.1925, Stellar has gained 83.33% on a daily and 131.84% on a 7-day basis. At the time of writing, XLM is exchanging hands at $0.30 after reaching intraday highs of $0.4399. Stellar is the 9th largest digital asset with a current market capitalization of $6.76 billion and an average daily trading volume of $8.4 billion. XLM benefits from a Ukrainian government partnership under which it will help lawmakers digitize the national fiat currency, the hryvnia. XLM also thrived on a positive sentiment shift from XRP following the Ripple SEC lawsuit. The Tie gives the long-term sentiment score for XLM to be 70 while XRP scores under 70. Before the legal action, XRP sentiment was at an all-time high.
*XLM began the year 2021 with an opening price of 0.1277 after which the bulls took charge
*XLM is exchanging hands at $0.30 after reaching intraday highs of $0.4399
*XLM benefits from a Ukraine government partnership
Key Levels
Resistance Levels: $0.4399, $0.4000, $0.3500
Support levels: $0.2500, $0.2090, $0.1500
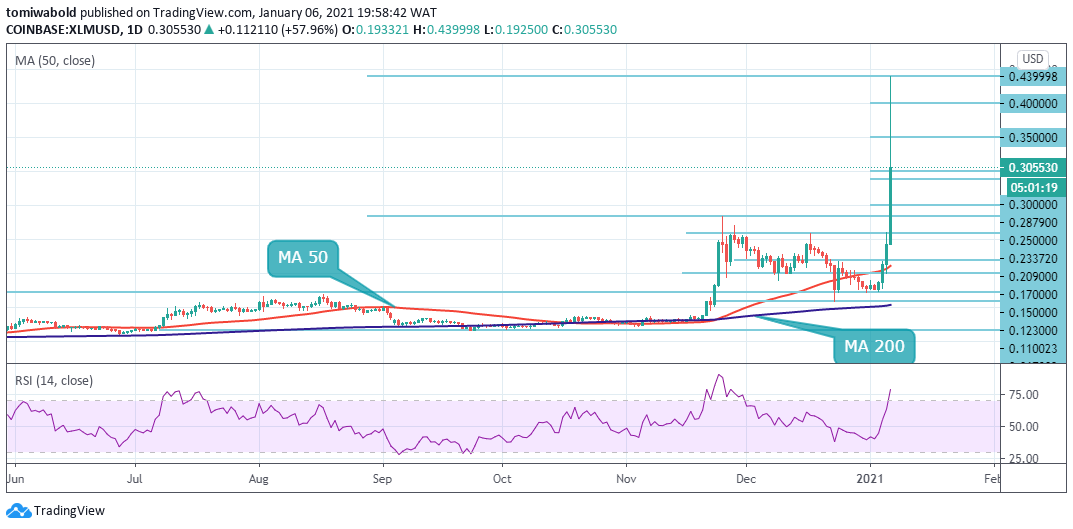 XLM/USD Daily Chart
On the daily chart, Stellar has climbed above several resistance levels to reach highs of $0.4399. Stellar has also reclaimed the MA 200 and the MA 50 as support levels. Looking ahead, if the buyers push higher again, a minor resistance may be encountered in the range between $0.35 to $0.40. The first major resistance is at $0.40 and the second at $0.4399.
Once these levels are flipped, a price target beyond $0.6 may be reached. Since the rally occurred in a quick spurt, Stellar’s Lumen left the major support and resistance levels above $0.3 to $0.43 untested. If the price turns down from current levels, the first support beneath $0.3 lies at $0.2879 and the second at $0.250.
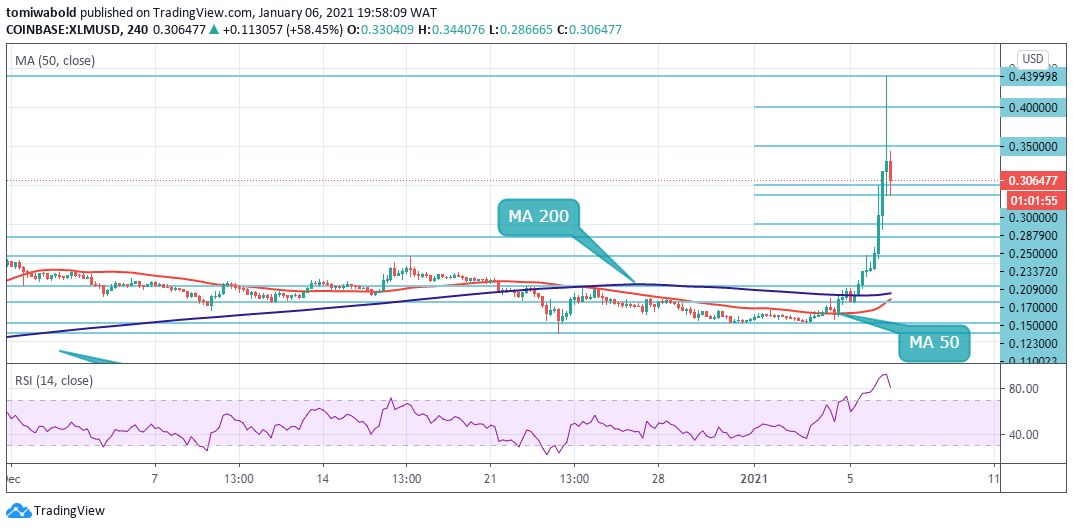 XLM/USD 4-Hour Chart
Stellar took off on January 5th when it confirmed the 4 hour MA 200 located at $0.16 as support. It continued a climb higher to$0.4399 where it met resistance and fell to the $0.3 price range subsequently. The bulls are currently attempting to sustain Stellar Lumens (XLM) above the $0.3 support. However, any rise from the current levels could face selling at $0.35 and then at $0.43.
On the upside, a sustained break past $0.4399 holds the key to XLM/USD uptrend. In this scenario, XLM could reach $0.6 and retest its all-time high of $0.897328. The XLM/USD pair is only bullish while trading above the $0.3 mark, key resistance is found at the $0.35 and 0.43 levels.
Note: Kryptomoney.com is not a financial advisor. Do your research before investing your funds in any financial asset or presented product or event. We are not responsible for your investing results
Image Credit: Shutterstock


Keep in mind that we may receive commissions when you click our links and make purchases. However, this does not impact our reviews and comparisons. We try our best to keep things fair and balanced, in order to help you make the best choice for you.
